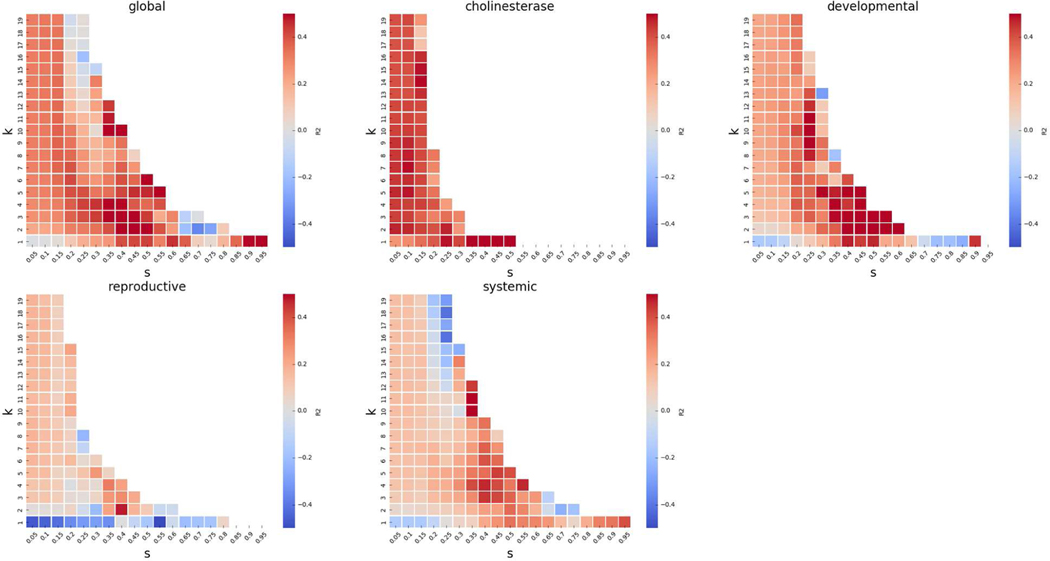
Figure 11.
GenRA performance for mean aggregated LOAEL values for exactly k neighbours. The performance of GenRA calculated as the coefficient of determination (R2) for exactly k analogues and Jaccard similarity score thresholds (s) is visualized as heatmaps for the entire dataset (global), cholinesterase inhibition, developmental effects, reproductive effects, and systemic effects. On each heatmap, increasing values of k (0<k<30) are shown in the rows (from bottom to top), and increasing values of s (0<s<1) are shown in the columns (from left to right). The color of each cell corresponds to the R2 value for a specific hyperparameter (k,s) combination where the red/blue indicate high/low R2 values.

