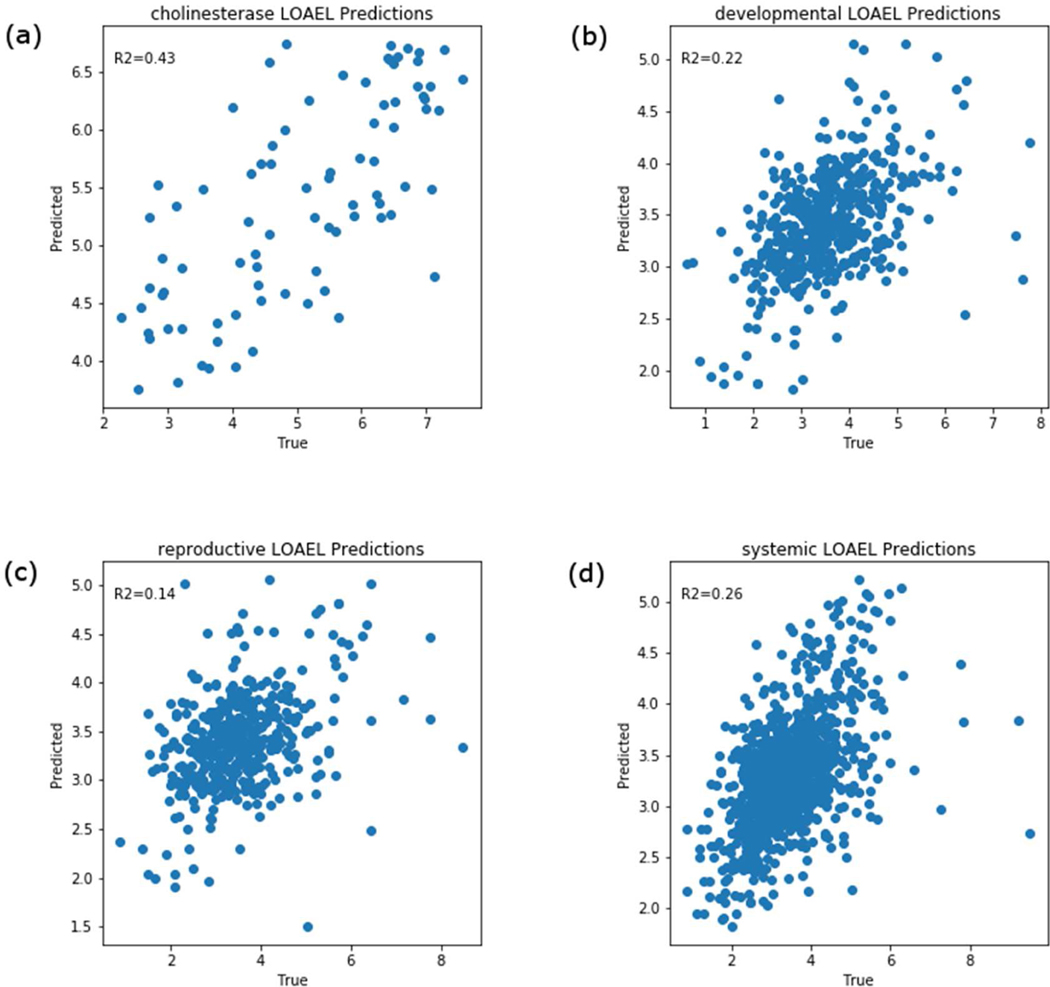
Figure 7.
GenRA predictions of the mean aggregated lowest observed adverse effect levels (LOAELs) for (a) cholinesterase inhibition, (b) developmental effects, (c) reproductive effects and (d) systemic effects. The predictions are based on k=10 (analogues) and s=0.05 (Jaccard similarity threshold). Each scatterplot shows GenRA predictions (y-axis) and the true mean aggregated LOAEL values in units of log10 molar of the daily mg/kg/day dose. The coefficient of determination (R2) values for GenRA predictions are shown in each plot.

