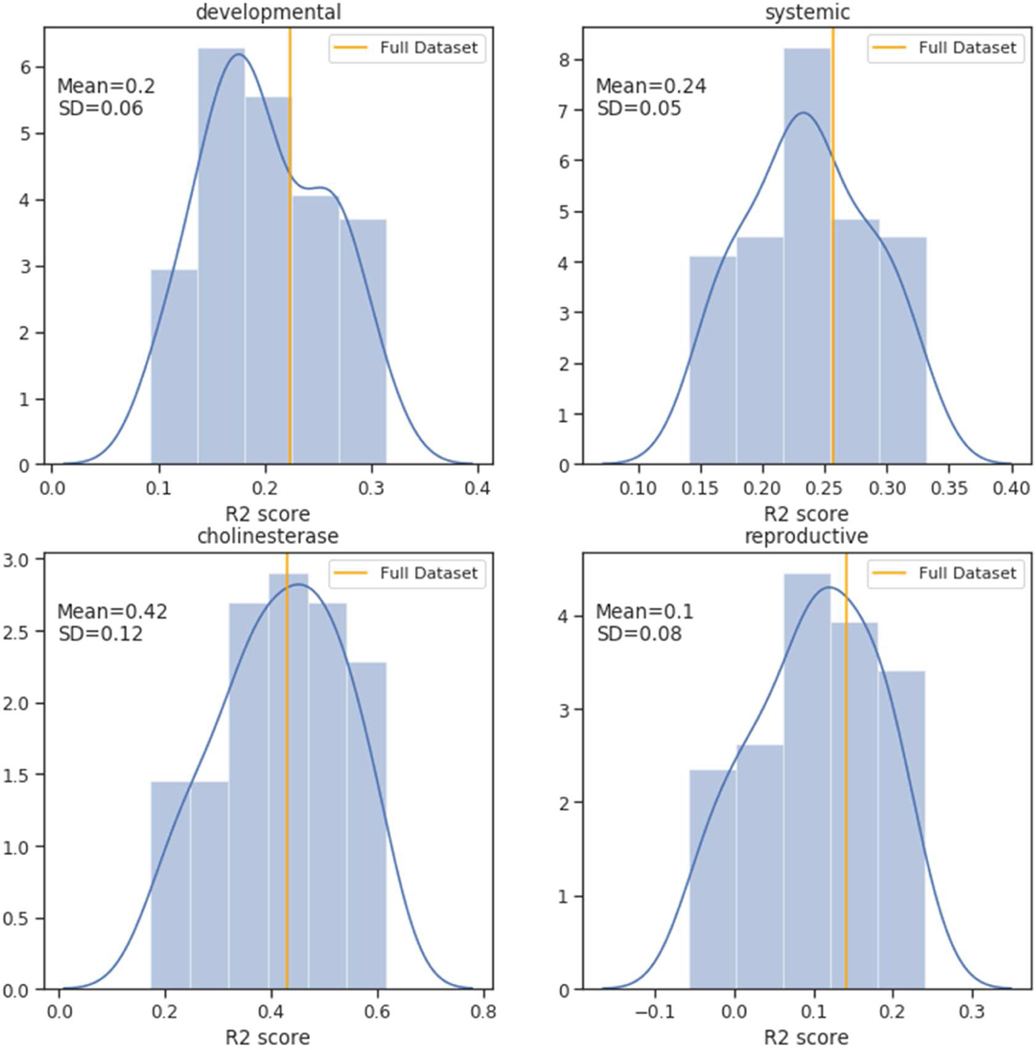
Figure 8.
GenRA cross-validation performance scores by endpoint category for mean aggregated LOAEL values. Each graph shows the distribution of the coefficient of determination (R2) scores (x-axis) for GenRA predictions based on k=10 and s=0.05, which were calculated using 100 cross-validation testing trials using a 90% training and 10% testing split of the data. The distributions are as visualized as histograms and smoothed density plots, and the performance of the full data set is shown for comparison (orange vertical line). The mean and standard deviation of performance scores are also shown on each graph.

