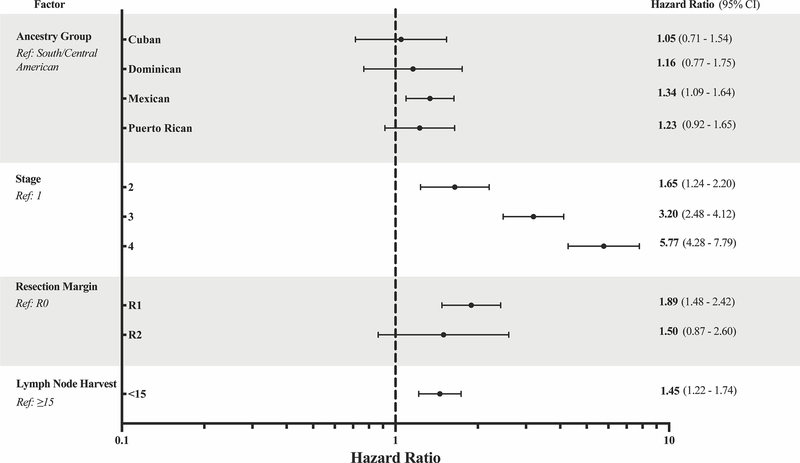
Figure 5.
Forest plot of adjusted hazard ratios for all-cause mortality. Hispanic ancestry group, age group at diagnosis, gender, treatment facility type, cancer stage, Charlson-Deyo score, surgical margins, and lymph node harvest were entered as covariates for stepwise selection in the multivariable model. Only significant factors are shown

