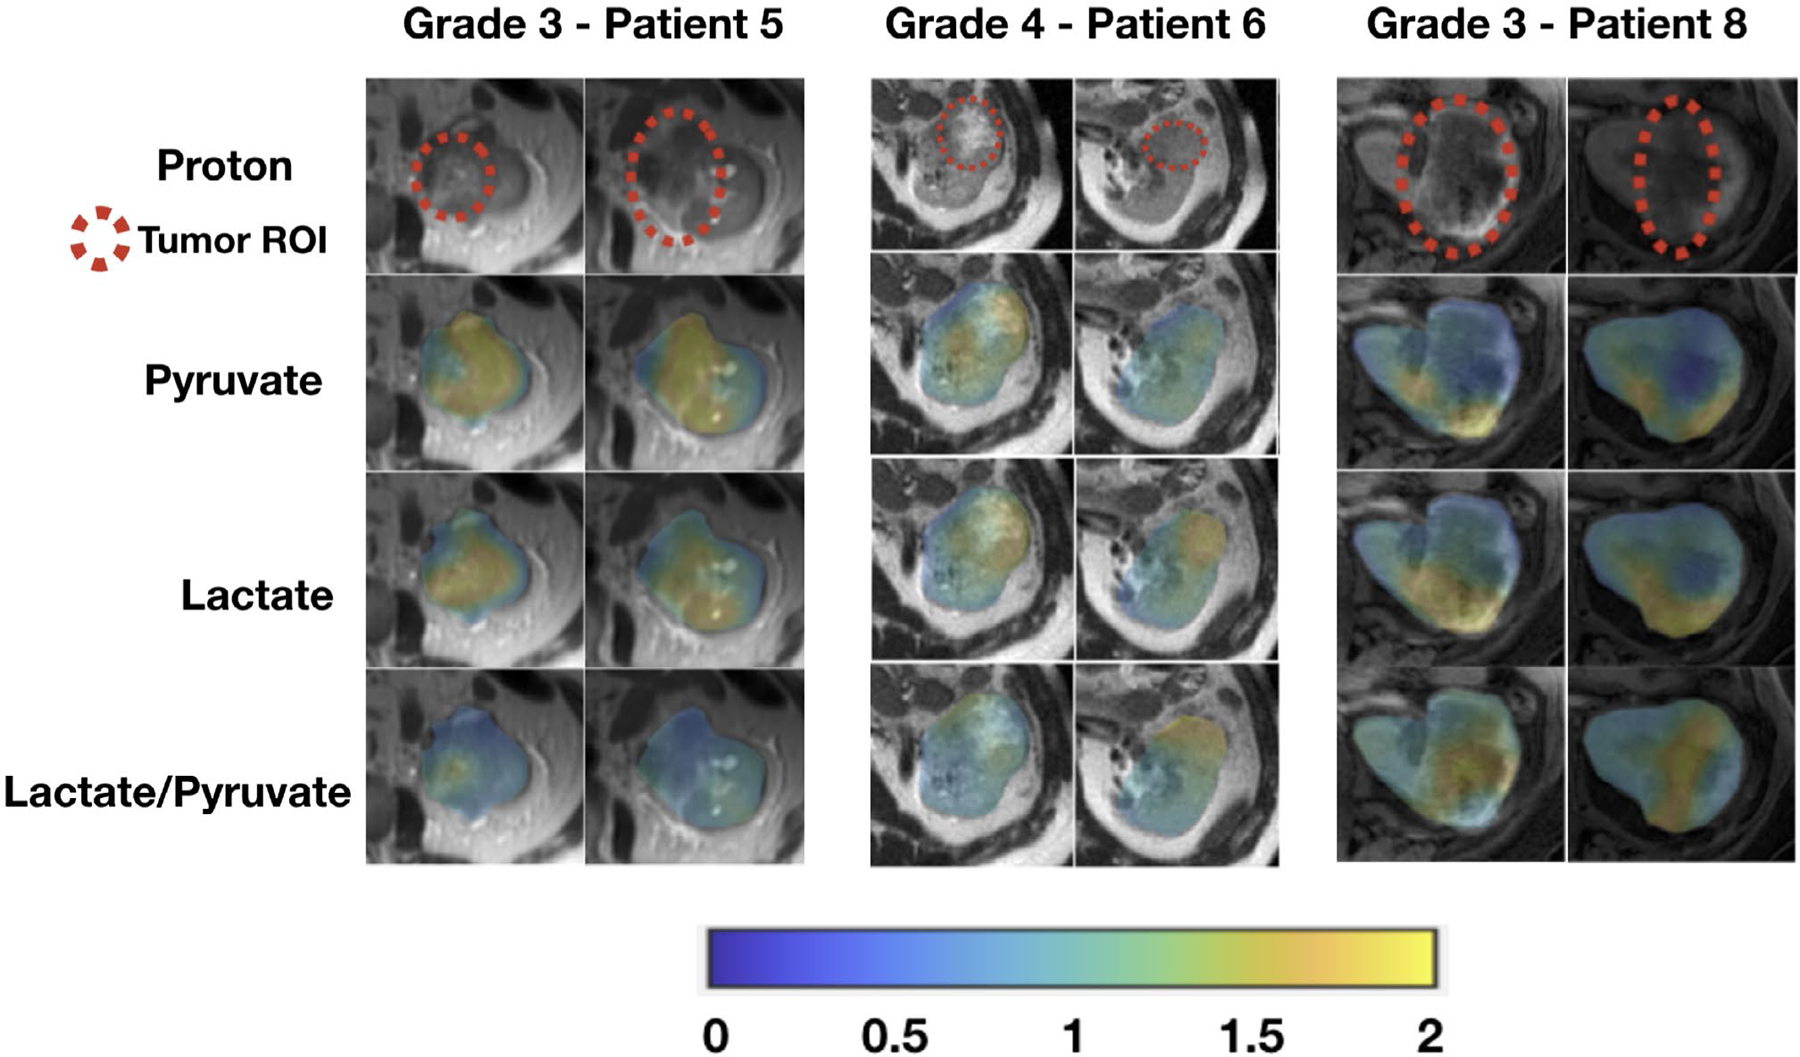
Figure 3.

These are area under the curve (AUC) images from hyperpolarized 13C pyruvate magnetic resonance imaging of patients with high-grade (grade 3 and grade 4) clear cell renal cell carcinomas. Tumor AUC values were normalized to AUC values of the adjacent normal parenchyma for each metabolite. Lactate-to-pyruvate ratios were calculated using the normalized AUC signals. All images are displayed using the same color scale. ROI indicates region of interest.
