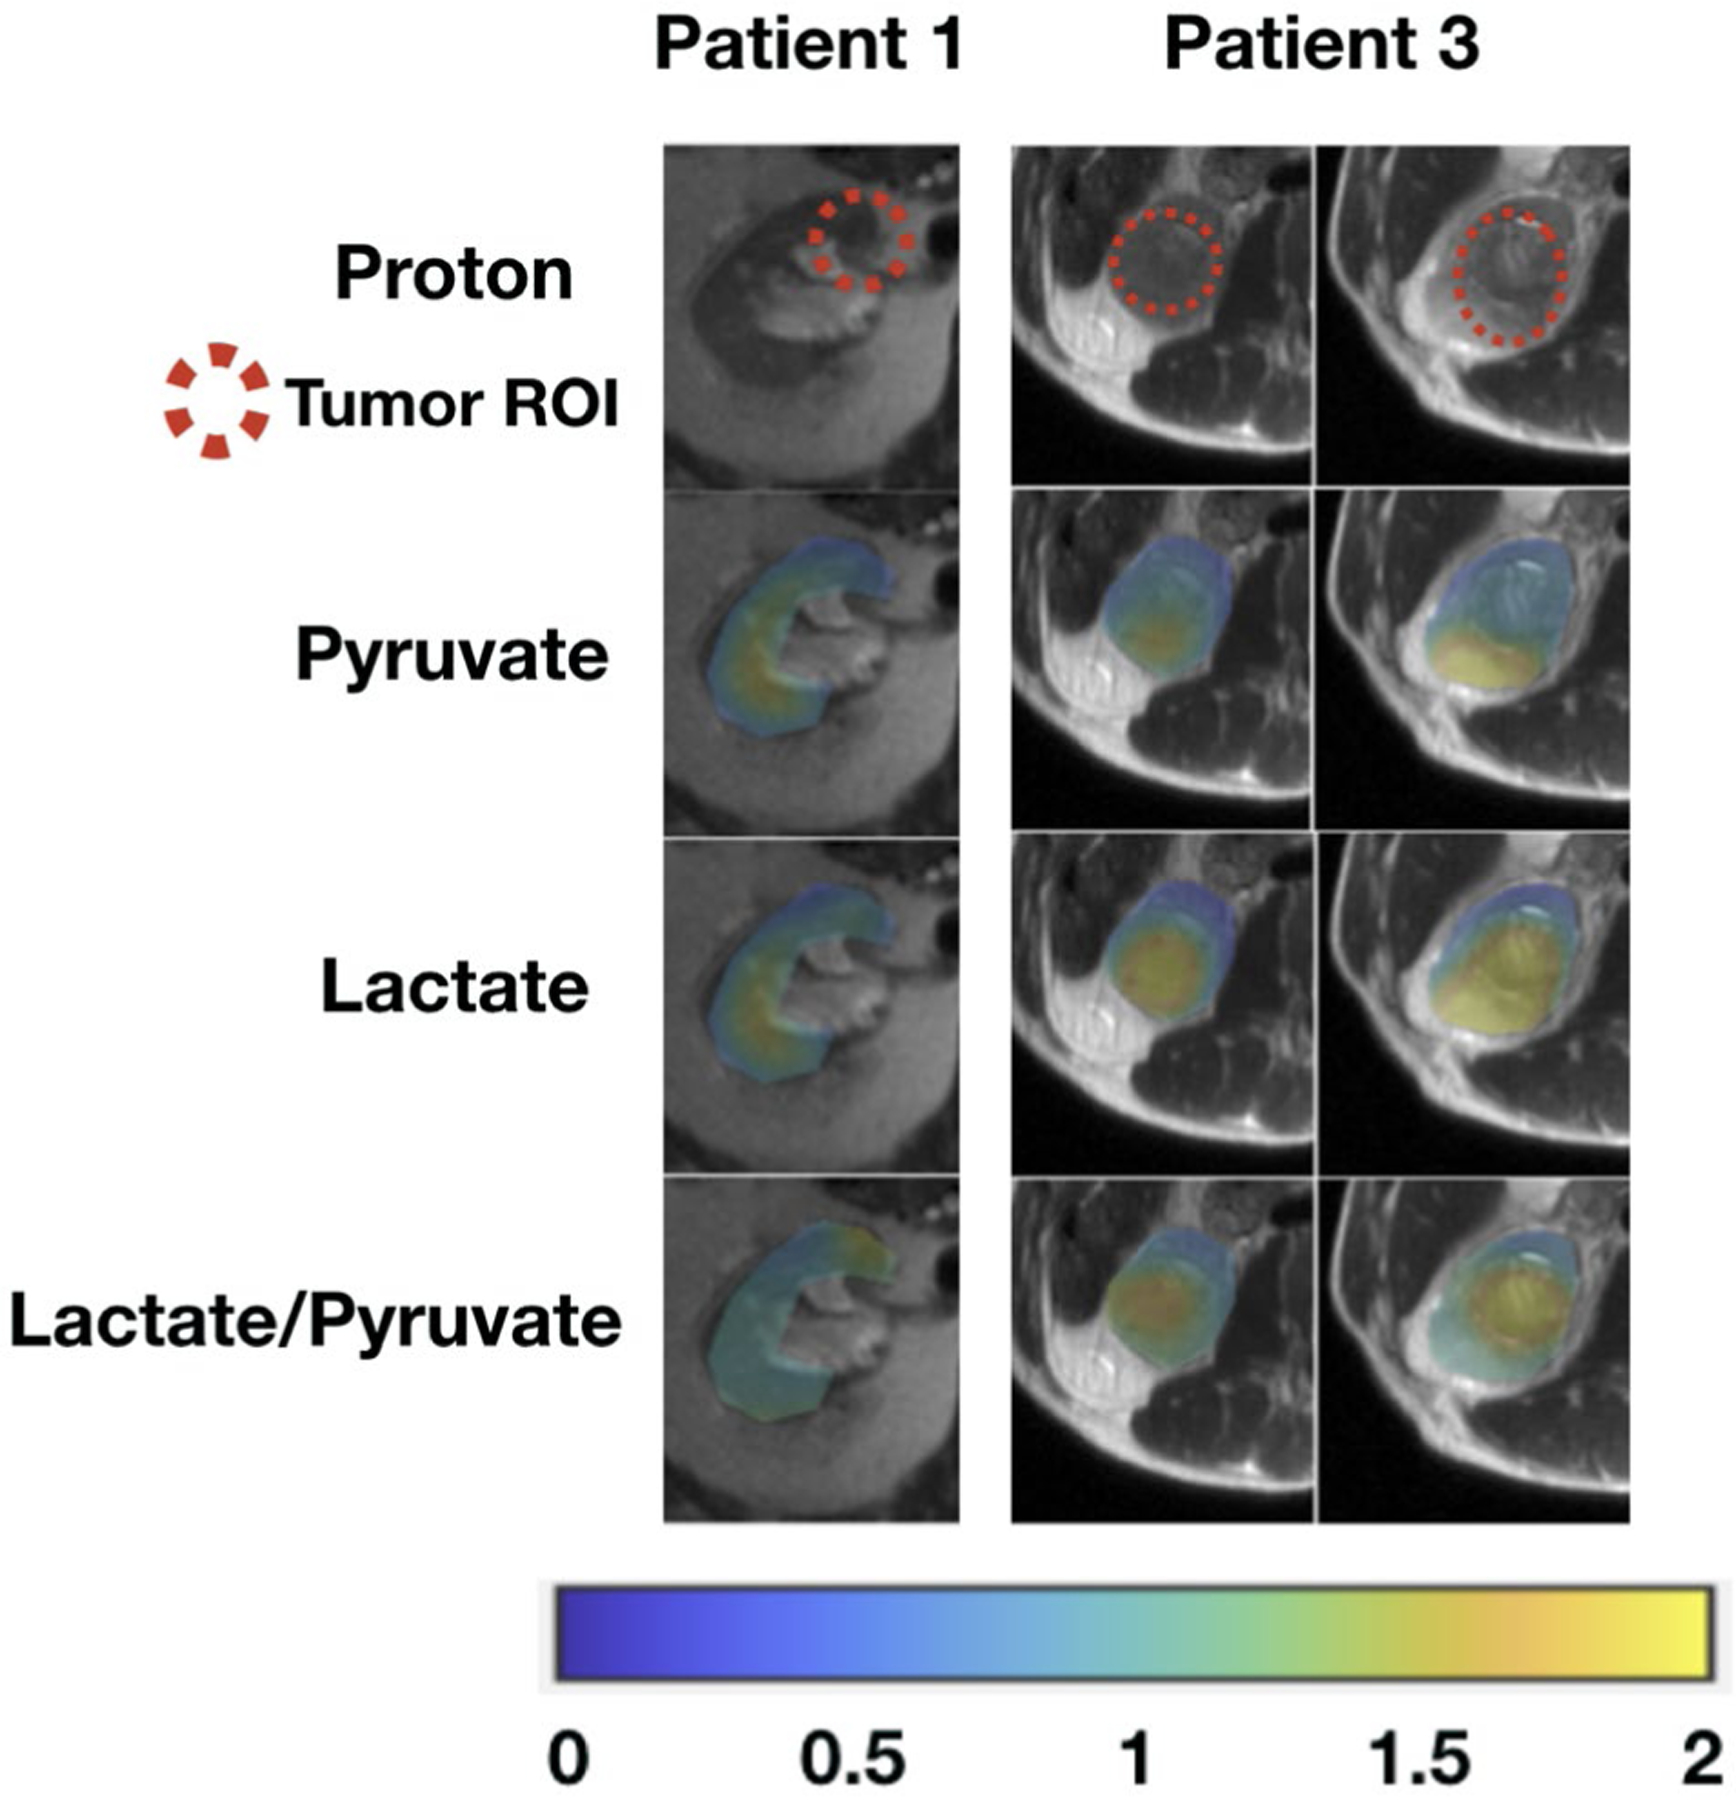
Figure 5.

These area under the curve (AUC) images from hyperpolarized 13C pyruvate magnetic resonance imaging of patients with chromophobe renal cell carcinomas. Tumor AUC values were normalized to AUC values of the adjacent normal parenchyma for each metabolite. Lactate-to-pyruvate ratios were calculated using the normalized AUC signals. All images are displayed using the same color scale. ROI indicates region of interest.
