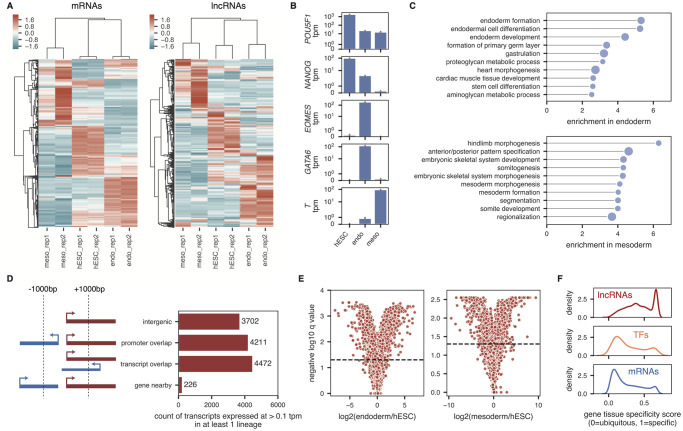
Fig 2. lncRNAs are differentially and specifically expressed across hESCs, definitive endoderm, and early mesoderm.
(A) Heatmap showing the expression, standardized per sample (column z-score) for the 10,000 most highly expressed protein-coding genes (left) and all 8,190 lncRNA genes with a minimum gene tpm of 0.1 in at least 1 sample (right). Genes (rows) and samples (columns) are hierarchically clustered using the correlation as the distance metric. (B) Average expression in each lineage of lineage marker genes POU5F1 (OCT4), NANOG, EOMES, GATA6, and T. Gray bars correspond to 90% confidence intervals, calculated across 2 biological replicates. (C) Top 10 gene ontology terms significantly enriched in either endoderm (top) or mesoderm (bottom) compared to undifferentiated hESCs. Size of dots is inversely proportional to the Bonferroni-corrected p-value; all plotted terms have p-values < 0.05. (D) Count of transcripts expressed at a minimum of 0.1 tpm in either hESCs, endoderm, or mesoderm, broken up into either protein-coding genes (blue) or lncRNAs (red). The lncRNAs are further classified based on their genomic proximity to other transcripts, as outlined in the schematic to the left. (E) Volcano plots showing the log2 expression fold-change between endoderm and hESCs (left) and mesoderm and hESCs (right) for all lncRNA transcripts. Horizontal lines define a q-value cut-off of 0.05. (F) Tissue-specificity of genes calculated across hESCs, endoderm, and mesoderm, for all lncRNA genes (top) and all mRNA genes (bottom) as well as a set of curated human transcription factors (middle) from Lambert et al. [44]. Gene-level tpms were used.

