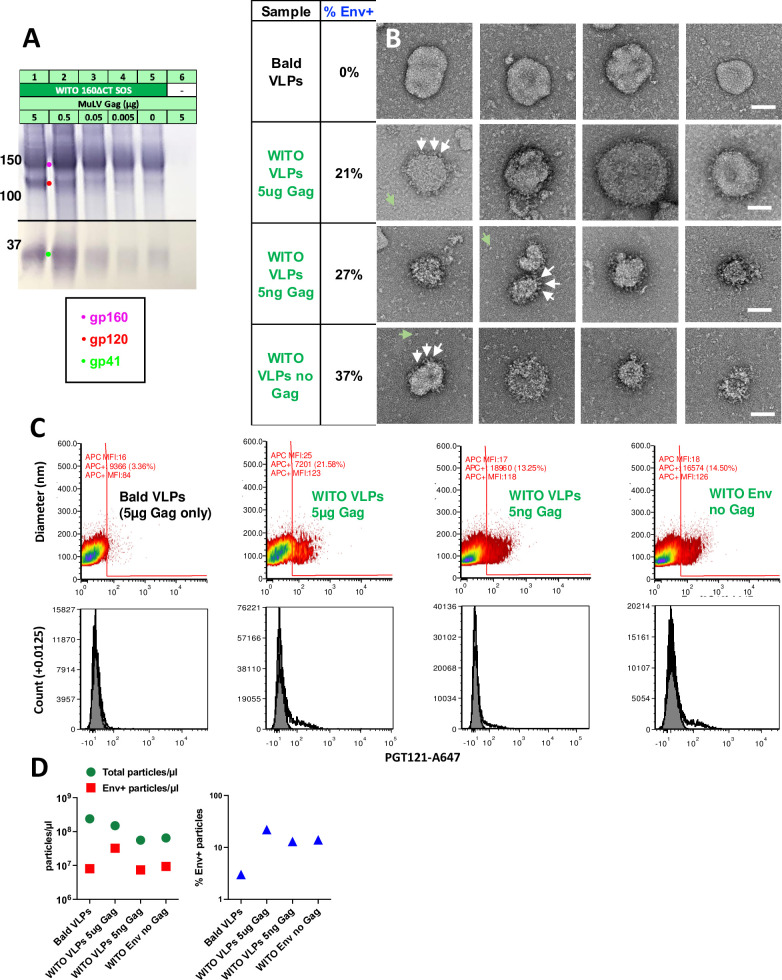
Fig 10. A quarter of particles from transfections using Env plasmid carry surface Env.
293T cells were transfected with WITO SOS gp160ΔCT and/or MuLV Gag, as indicated in part A). Supernatants were precleared, filtered and 1,000-fold concentrated. Samples were probed by A) SDS-PAGE-Western blot, B) negative stain EM (scale bars are 50nm, white arrows point to candidate Env trimers and green arrows point to possible dissociated spikes, and C) Single vesicle flow cytometry. Upper panels show particle diameters and fluorescence intensities after staining with Alexa-647-labeled PGT121. In the lower panel, we show total particle counts versus Alexa-647 fluorescence. D) Total particle and Env+ particle counts per μl of samples are indicated (left) and % Env+ particles as a proportion of total particles (right). Raw vFC data files and data analysis layouts have been deposited in Flowrepository (flowrepository.org; see S6 Text).

