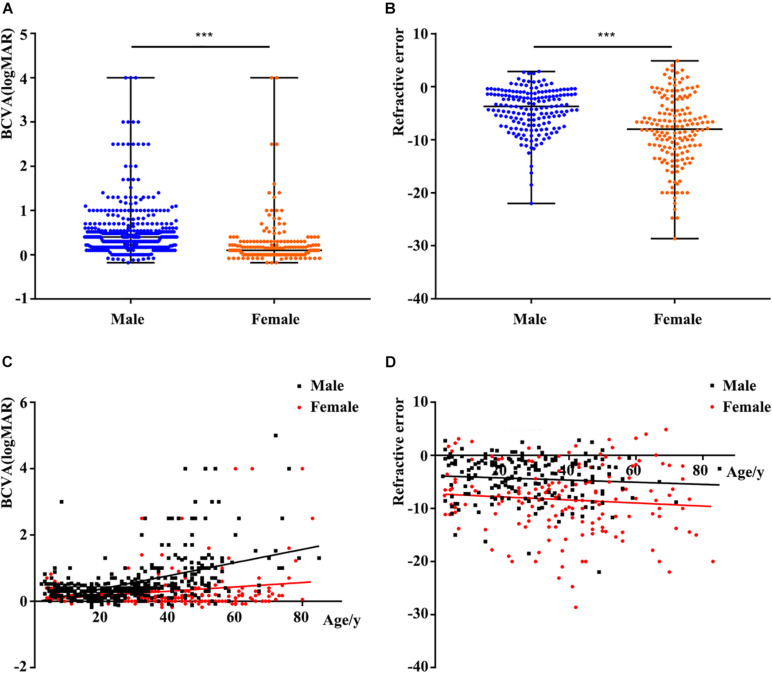
FIGURE 2.
Comparison of phenotypes according to different factors. (A) Comparison of logMAR BCVA between males and females. The BCVA of female carriers was better than that of male patients. (B) Comparison of refractive error (RE) between males and females. Spherical equivalent refraction represents the severity of RE. The RE of female carriers was more serious than that of males. (C) Scatterplots of logMAR BCVA and age, the two fitted lines correspond to male (black) and female (red) patients. A significant reduction of BCVA with increase of age in both males and females. (D) Scatterplots of RE and age, the two fitted lines correspond to male (black) and female (red) patients. The trends of the two lines are basically smooth. BCVA, best corrected visual acuity. ∗∗∗, P value less than 0.001.

