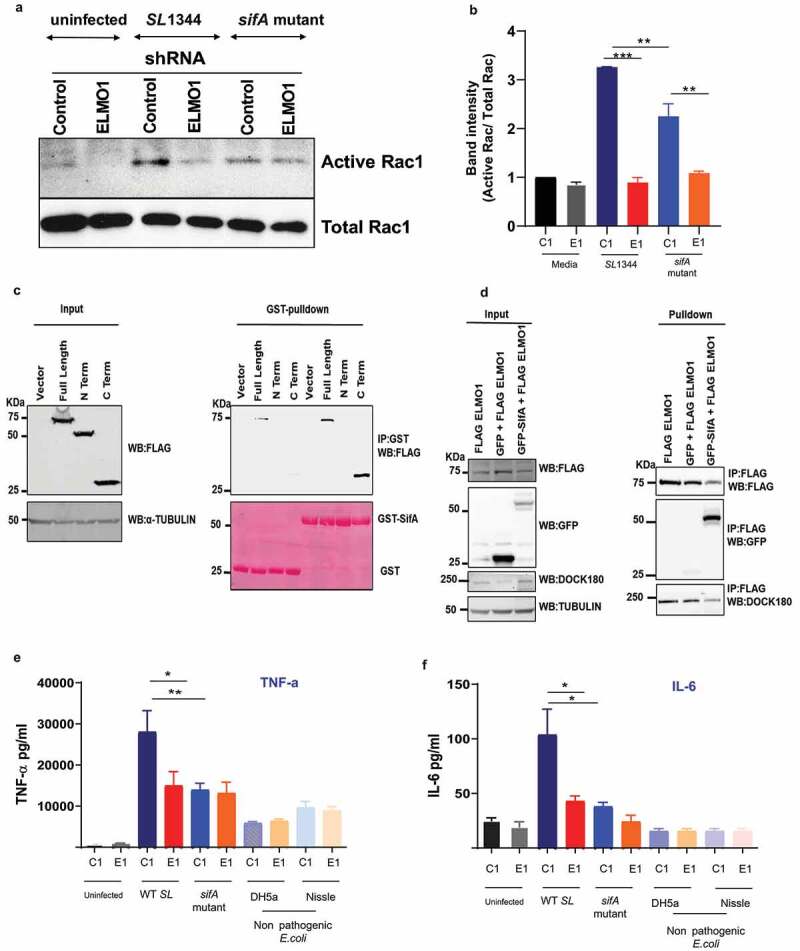
Figure 4.

Effect of ELMO1–SifA interaction on induction of immune responses in control and ELMO1 shRNA cells (a) Control (C1) or ELMO1 shRNA (E1) J774 cells were infected with WT SL or sifA mutant strain for 1 h, Rac1 Activity was assessed by pull down assay using GST-PBD beads, followed by WB for active (GTP bound) Rac1 (upper panel) and total Rac1 (lower panel) using Rac1 Antibody. (b) The band intensity for active Rac1 in (A) was normalized to total Rac1 and the ratio of active Rac1/ total Rac1 was quantified in all samples. The densitometry was done with 3 individual experiments **. *** means p < .01 and 0.001, respectively. (c) HEK293 cells transfected with FLAG tagged ELMO1-full length (FL) (aa 1-727), FLAG tagged ELMO1- N terminal (NT) (aa-1-532) and FLAG tagged ELMO-1- C terminal (CT) (aa-532-727) , were lysed and incubated with GST-SifA immobilized to glutathione-sepharose affinity beads. . (Right) represents pulldown assays using anti-Flag antibody (upper panel) and Ponceau S stain (lower panel). (Left): Western blot of the input cell lysates using anti-Flag antibody (upper panel), and α-Tubulin was used as a loading control (d) Co-immunoprecipitation assay to check any interference in the binding of Dock180 when ELMO1 interacts with SifA. FLAG-ELMO1 and GFP-SifA were transfected in HEK293 cells followed by cell lysis and IP using anti-FLAG antibody. Proteins were visualized by immunoblotting with corresponding antibodies. (e-f) Control (C1) or ELMO1 shRNA (E1) J774 cells were infected with WT SL1344, sifA mutant strain, and nonpathogenic E. coli (e), IL-6 (f), was measured by ELISA in the supernatant of infected cells. *, ** means p ≤ 0.05, and ≤ 0.01, respectively as assessed by one-way ANOVA multiple comparisons
