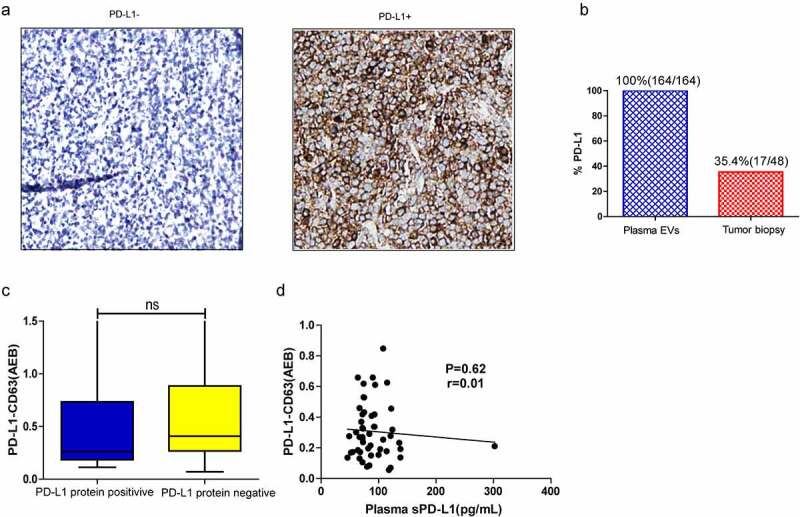
Figure 4.

(a) Representative IHC image of PD-L1 negative (PD-L1−) or positive (PD-L1+) tumors (22C3 antibody). (b) Percentage of patients positive for PD-L1 in circulating EVs versus tumor tissues. (c) The PD-L1-CD63 signal between PD-L1 protein positive and negative group. (d) Correlation between the PD-L1-CD63 signaling and sPD-L1 level in the plasma; Spearman’s correlation at P = .19, r = 0.03
