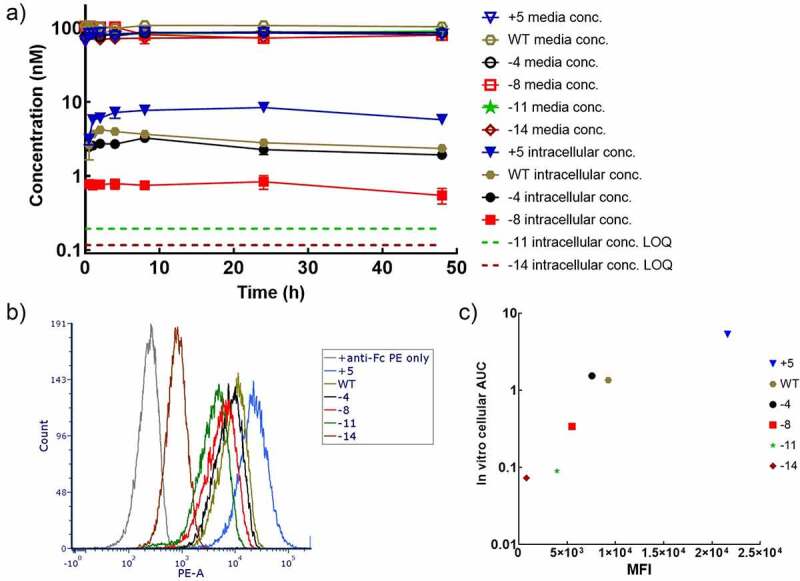
Figure 2.

Influence of charge on cell disposition of mAbs. A) Concentration-time profiles of charge variants in the cell media and MDCK cells. B) MDCK cell surface binding of charge variants characterized in flow cytometry. C) The correlation between intracellular AUC obtained in cellular PK experiments and MFI binding signals in flow cytometry
