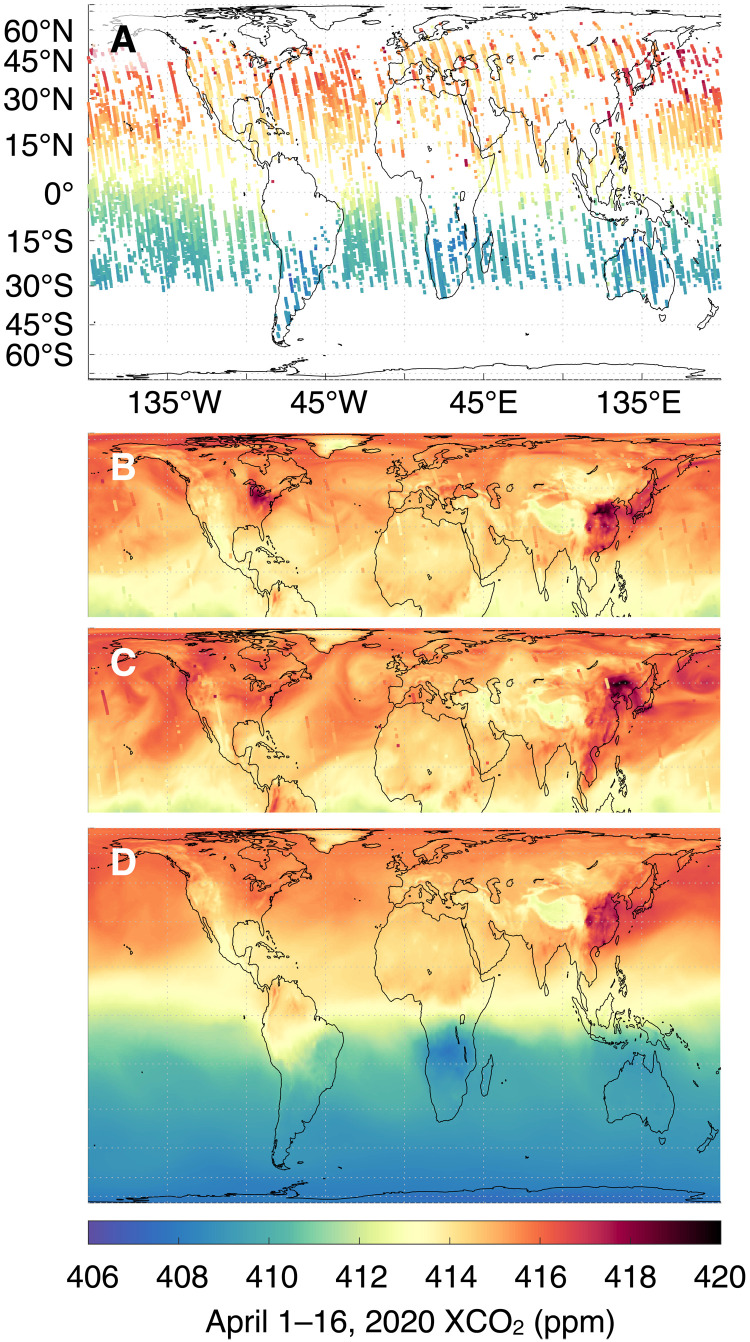
Fig. 1. Snapshots of OCO-2 XCO2 soundings and assimilated GEOS/OCO-2 fields.
(A) Sixteen days of OCO-2 XCO2 soundings on 1 to 16 April 2020. (B and C) Daily mean GEOS/OCO-2 XCO2 at the beginning, 1 April 2020 (B), and end, 16 April 2020 (C), of the 16-day period with 8 days of assimilated OCO-2 data overlaid on each. (D) The 16-day average of assimilated GEOS/OCO-2 XCO2 over the same period. DA combines satellite observations (A) with a weather-resolving atmospheric model (B and C) to form gridded, time-varying, 3D fields (fig. S1), from which averages (D) and uncertainties (Figs. 2 to 5) follow. Because it accounts for the several ppm changes in the Northern Hemisphere from (B) to (C) due to meteorological and submonthly flux variability, the assimilation system can detect and quantify the much smaller COVID-19 signal (see Materials and Methods and fig. S4). Monthly OCO-2 coverage and assimilated fits to data are depicted in figs. S2 and S3.

