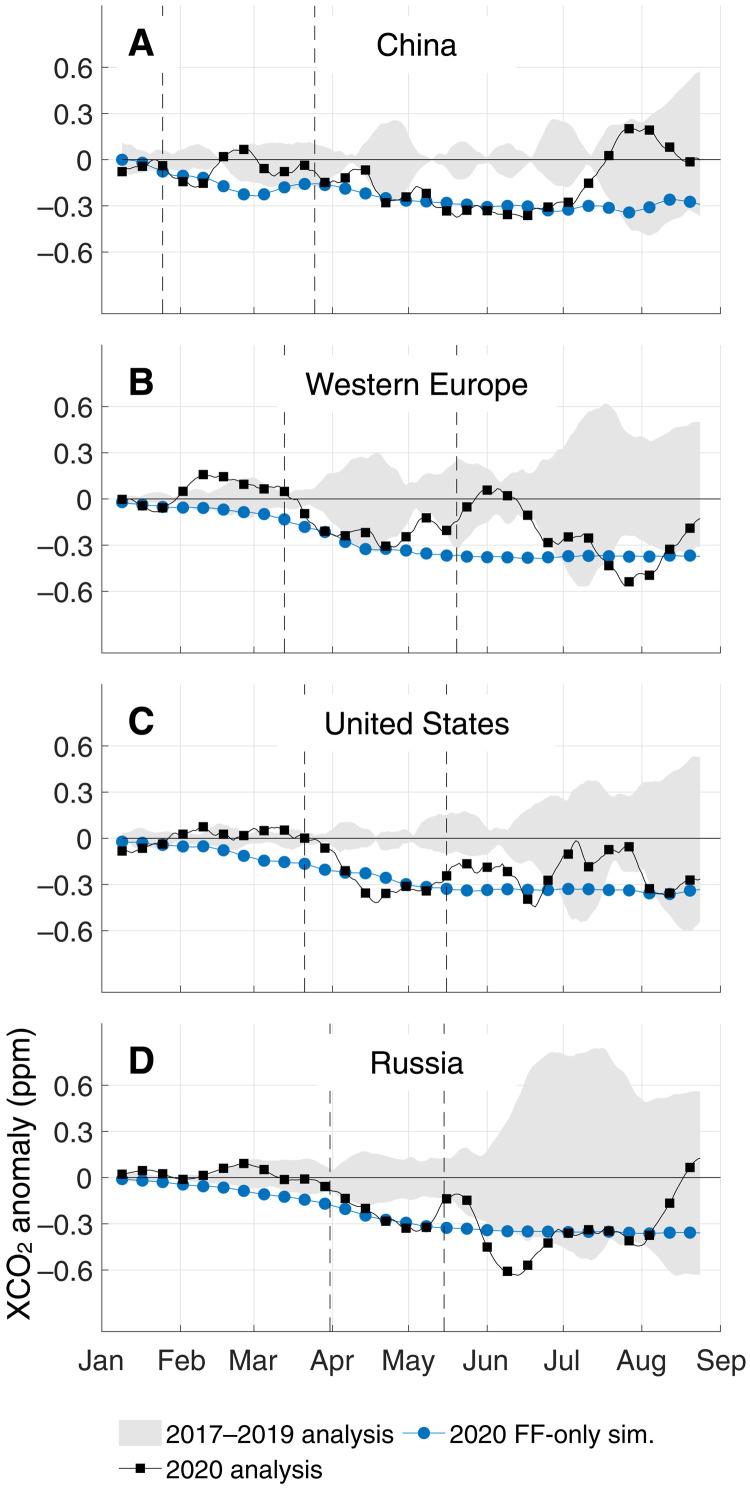
Fig. 3. Time series of regional GEOS/OCO-2 16-day moving average XCO2 anomalies.
(A) China, (B) Western Europe, (C) the United States, and (D) Russia. The solid black line with boxes indicates the 2020 anomaly, the gray shaded area indicates the spread of anomalies across the baseline years (2017–2019), and the blue circles indicate transport simulations for 2020 using activity-based fossil fuel (FF) emission estimates (3). Dashed lines mark a rough beginning and end (when appropriate) to confinements for each area and are provided in Table 1. For additional simulations and analysis including histograms of daily sounding counts, see fig. S8.

