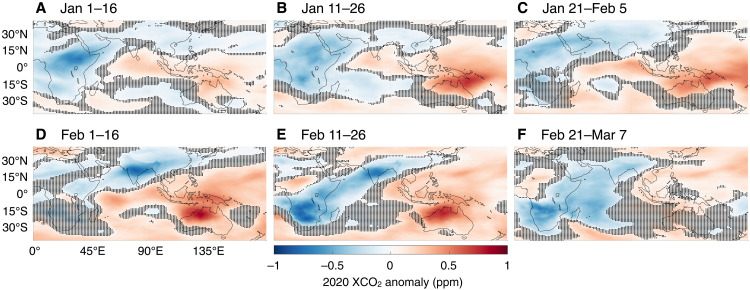
Fig. 4. Identical to but Fig. 2 over the Indian ocean before the start of COVID-19–related confinements.
In contrast to Fig. 2, the dominant signal shown here is from the carbon-climate teleconnection between the 2019–2020 Indian Ocean Dipole (IOD), the strongest on record, and terrestrial biospheric exchange. In January (A to C) and February (D to F) 2020, there was increased biospheric uptake over India and Africa (blue colors) due to greater-than-average precipitation in the preceding months, while there were increased respiration and biomass burning over Australia and Southeast Asia (red colors) due to greater-than-average temperatures.

