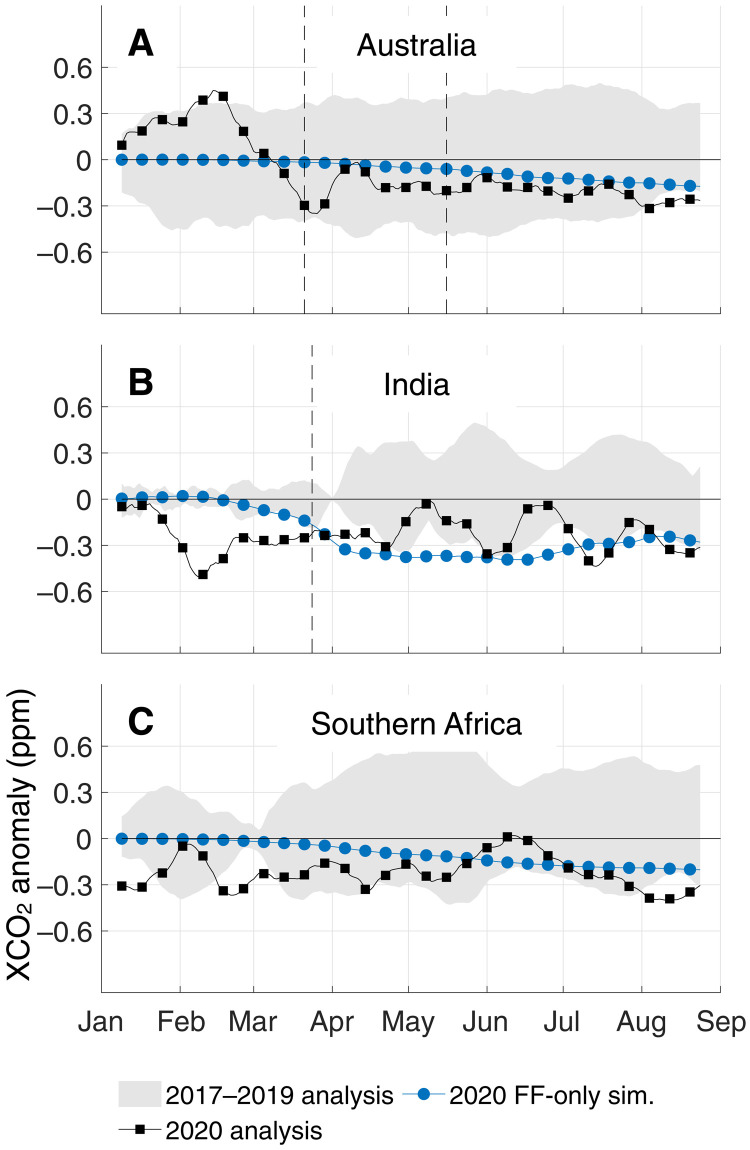
Fig. 5. Identical to Fig. 3 but for different regions.
(A) Australia, (B) India, and (C) southern Africa. The dominant signal is that of the IOD impact over India, but most of the anomalies are within the range of typical changes. As opposed to the Northern Hemisphere (Fig. 3), early in the calendar year is a time of substantial biospheric activity in the Tropics and Southern Hemisphere (figs. S5 to S7), complicating the interpretation of any anthropogenic variability. For corresponding histograms of daily sounding counts, see fig. S9.

