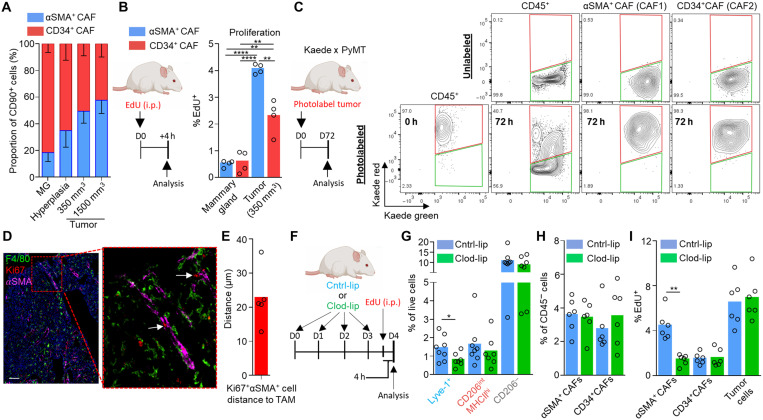
Fig. 5. Lyve-1+ TAMs orchestrate αSMA+ CAF expansion within the perivascular niche of the tumor.
(A) Abundance of the respective CAF populations during distinct stages of tumor progression; n = 6 mice per stage. MG, mammary gland. (B) Schematic for experimental approach and dosing EdU into MMTV-PyMT mice to assess in vivo proliferation (left) and proportion EdU+ cells within each CAF subset (right). i.p., intraperitoneally. (C) Established tumors in Kaede MMTV-PyMT mice were photoconverted to Kaede-red, and then at 72 hours after photoconversion, tumors were analyzed (schematic left) for their respective Kaede-red/green proportion using flow cytometry for evidence of peripheral recruitment (Kaede-green cells). A representative unconverted tumor is shown for comparison (right top). (D and E) Representative image of a frozen section of MMTV-PyMT tumor stained with antibodies against F4/80 (green), αSMA (magenta), and the proliferation marker Ki67 (red). White arrows show αSMA+Ki67+ cells in contact with F4/80+ TAMs (D) and quantification of Ki67+αSMA+ cell median distance from F4/80+ TAMs quantified from immunofluorescence images across multiple tumors (n = 5) (E). (F to I) Schematic for experimental approach and dosing strategy to acutely deplete Lyve-1+ pvTAM with clodronate-filled liposome treatment for 4 days (F). (G) Abundance of TAM populations following control- or clodronate-filled liposome treatment (n = 6 mice Cntrl-lip and n = 5 mice Clod-lip). (H) Abundance of CD45− cell populations (cohorts of n = 6 mice) after 4 days of treatment with either control- or clodronate-filled liposomes. (I) Proportion of EdU+ cells within each CD45− cell subset (cohorts of n = 6 mice). Bar charts represent mean, error bars represent SD, and the dots show individual data points from individual tumors and mice. *P < 0.05, **P < 0.01, and ****P < 0.0001.

