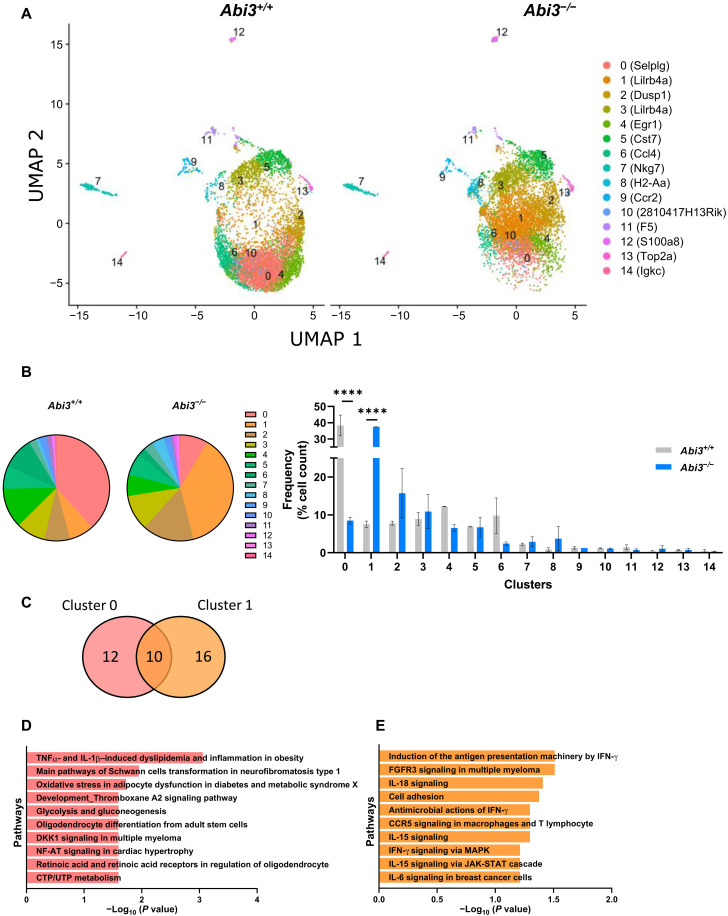
Fig. 8. Targeted scRNA-seq identifies a distinct microglia signature in Abi3−/− mice on 5XFAD background.
(A) Uniform Manifold Approximation and Projection (UMAP) dimensionality reduction plot showing 14 clusters of cells derived from 9-month-old male Abi3+/+ and Abi3−/− mouse brain (Abi3+/+, n = 6970 cells; Abi3−/−, n = 6799 cells). Top marker genes (as ranked by significance) are displayed after each cluster number in the legend. (B) Percentage of cell populations in each cluster was compared between the genotypes. Cluster 0 is the major cell population in Abi3+/+ mice, whereas cluster 1 is the major cell population in Abi3−/− mice (left). While the cells in cluster 0 significantly decreased, cluster 1 population significantly increased in Abi3−/− mice compared to Abi3+/+ mice (right). Data represent means ± SEM. Two-way ANOVA and Sidak’s multiple comparisons test; ****P < 0.0001. (C) The number of genes detected in clusters 0 and 1. (D and E) Pathway analyses were performed using the MetaCore software. Pathway analysis of (D) cluster 0–specific genes and (E) cluster 1–specific genes. CTP/UTP, cytidine 5′-triphosphate/uridine 5′-triphosphate; IFN-γ, interferon-γ; JAK-STAT, Janus kinase signal transducers and activators of transcription; MAPK, mitogen-activated protein kinase; FGFR3, fibroblast growth factor receptor 3; NF-AT, nuclear factor of activated T-cells.

