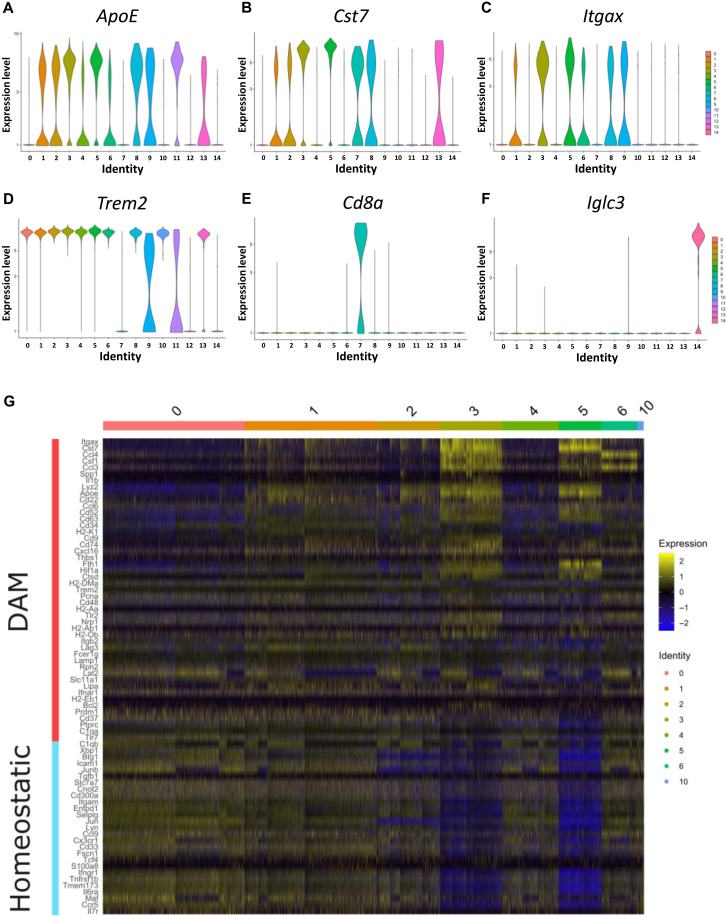
Fig. 9. Expression of DAM genes and other cell type–specific marker genes in scRNA-seq analysis.
(A to F) Targeted scRNA-seq analysis identified 14 clusters of cells derived from 9-month-old male Abi3+/+ and Abi3−/− mouse brain (Abi3+/+, n = 6970 cells; Abi3−/−, n = 6799 cells). Each plot displays the raw counts on the y axis and cluster identity on the x axis. Among the DAM marker genes, the expression of (A) Apoe, (B) Cst7, (C) Itgax, and (D) Trem2 were analyzed for each cluster. (E) Cd8a, T cell marker gene, was detected only in cluster 7. (F) Iglc3, B cell marker gene, was detected only in cluster 14. (G) Heatmap showing DAM and homeostatic microglia marker genes across microglial clusters (0 to 6 and 10). The level of gene expression is averaged per gene across all clusters; up-regulation compared to the mean expression level is shown in yellow and down-regulation in blue.

