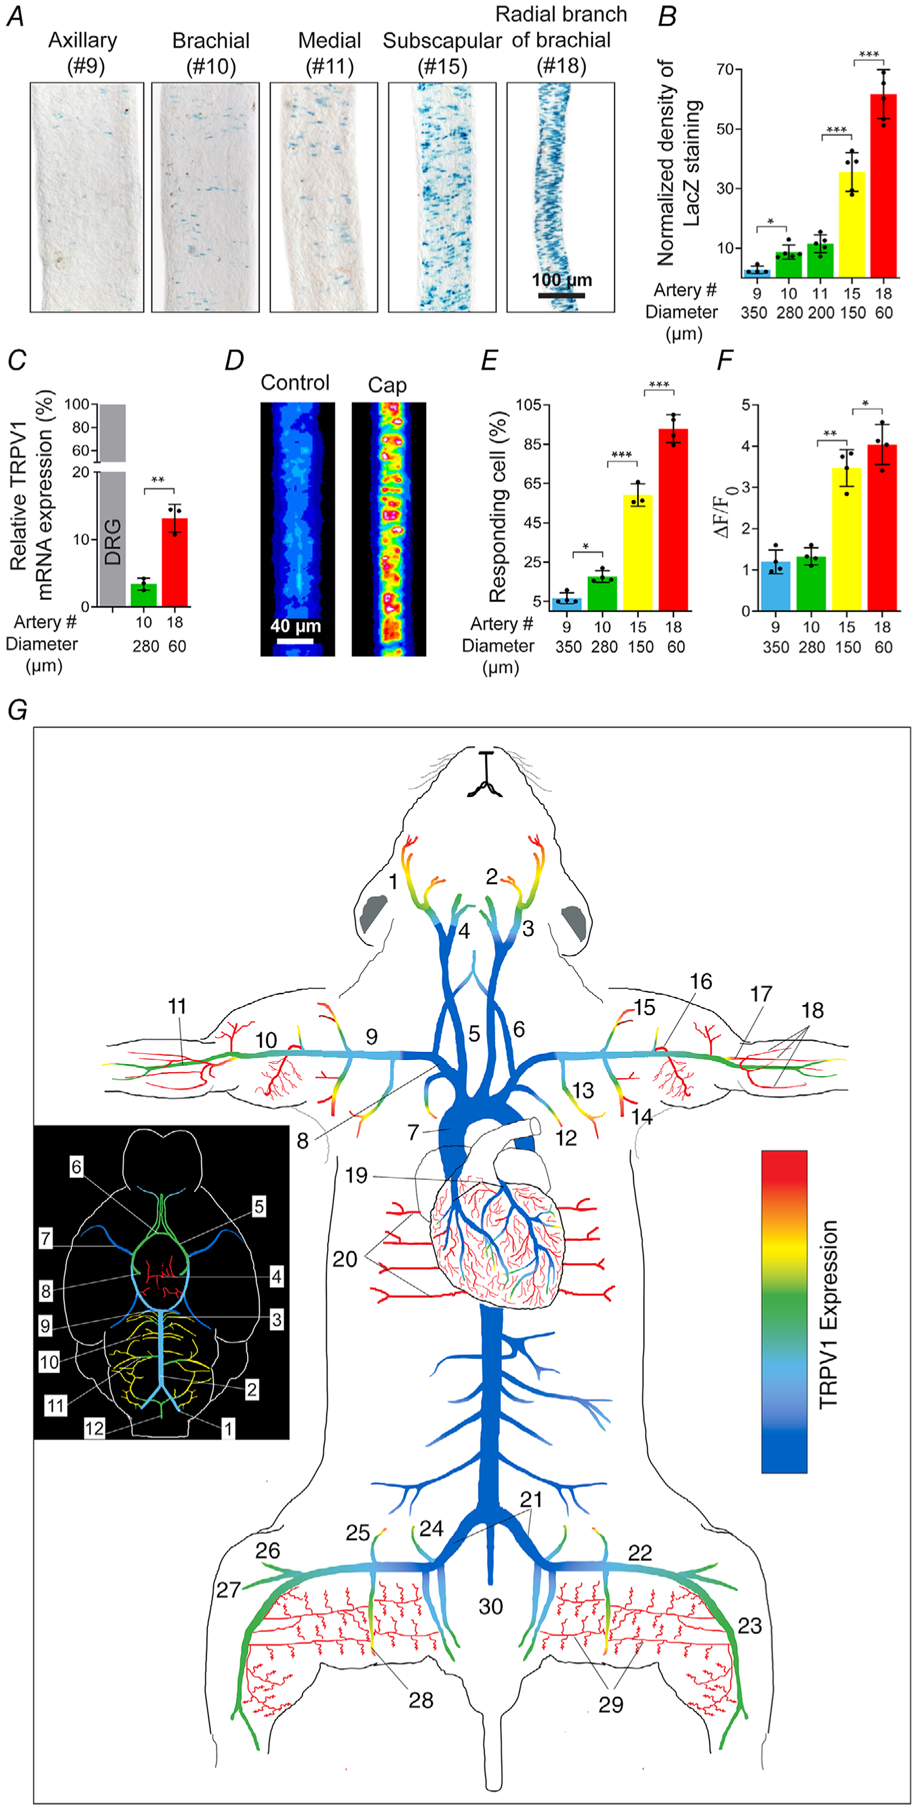
Figure 6. An arterial map of functional TRPV1 expression.

A and B, TRPV1 expression (nuclear LacZ staining) in forelimb arteries and muscle branches versus vessel diameter (n = 4–6 arteries from five mice per group, one-way ANOVA, *P < 0.05, ***P < 0.001). C, TRPV1 mRNA measured by qRT-PCR in small and large-diameter arteries relative to DRG (n = 3–4 mice, unpaired t test, **P = 0.0017. D–F, capsaicin (1 μm)-evoked Ca2+ responses in forelimb arteries of different diameter (no. 9, n = 85; no. 10, n = 92; no. 15, n = 136; no. 18, n = 150 from three independent experiments, one-way ANOVA, *P < 0.05, **P = 0.0029, ***P < 0.001). G, heat-map of TRPV1 expression in arteries based on TRPV1PLAP-nlacZ mice (n = 15 mice) and confirmed by functional imaging. The inset shows the density of TRPV1 expression in cerebral arteries. Arterial colour-coding is similarly applied to B–F. Artery nomenclature is included in Table 1.
