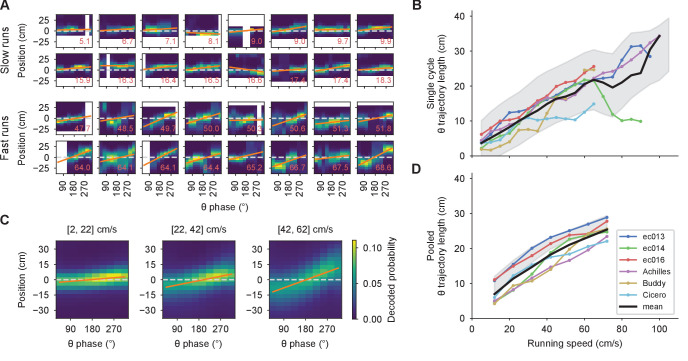
Figure 3. Theta trajectory lengths increase proportionally with running speed.
(A) A random sample of theta sequences from a representative experimental session, with position probabilities decoded from the population spikes. Zero corresponds to the actual position of the rat at the middle of the theta cycle; negative positions are behind and positive ones, ahead. Orange lines indicate linear fits, from which theta trajectory lengths are computed. White pixels correspond to positions outside of the track or phase bins with no spikes. The red number at the lower right corner indicates the running speed in cm/s. (B) Moving averages for theta trajectory length for each animal using a 10 cm/s wide sliding window (colored lines). These averages are averaged again (thick black line) to obtain a grand average that weighs all animals equally. Shaded region indicates a standard deviation around the mean of all data points pooled across animals, which weigh each theta sequence equally. This mean does not necessarily match the grand average since different animals contribute different numbers of theta sequences. (C) Similar to A, but averaging the decoded probabilities across theta cycles belonging to the same speed bin indicated above the panel. (D) Similar to B for the averaged cycles, confirming the observation in B.

