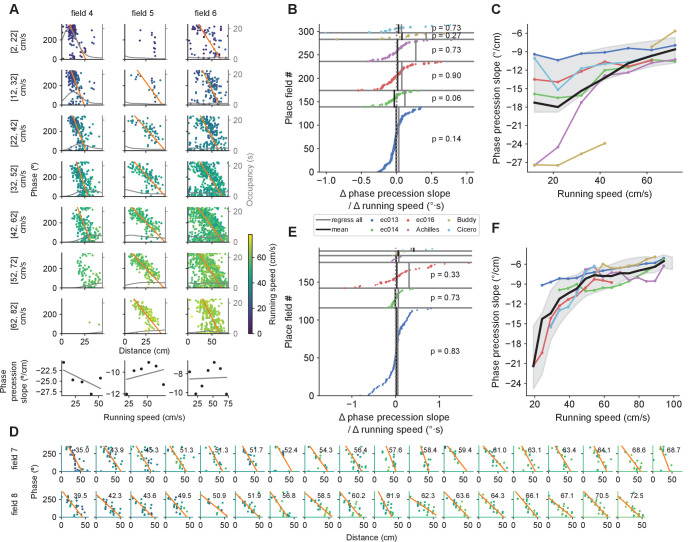
Figure 5. Phase precession slope increases with running speed when combining data across fields, but not for individual fields.
(A) Example phase precession slopes at different speeds for three fields. Instantaneous speeds when the spikes where emitted are color coded. Thin gray line displays the occupancy. At the bottom, linear regressions on phase precession slope versus running speed for each place field. (B) Similar to Figure 4B for the slopes of the linear regressions on phase precession slope vs. running speed for individual fields. (C) Similar to Figure 4C for phase precession slopes combined across fields for each speed bin. (D) Example phase precessions in single passes through two place fields (rows) sorted by running speed (upper right corner, in cm/s). Color code as in A. (E, F) Same as in B and C but for single-trial phase precession slopes. The means for each animal in F were calculated as a moving average on a 10 cm/s wide sliding window.

