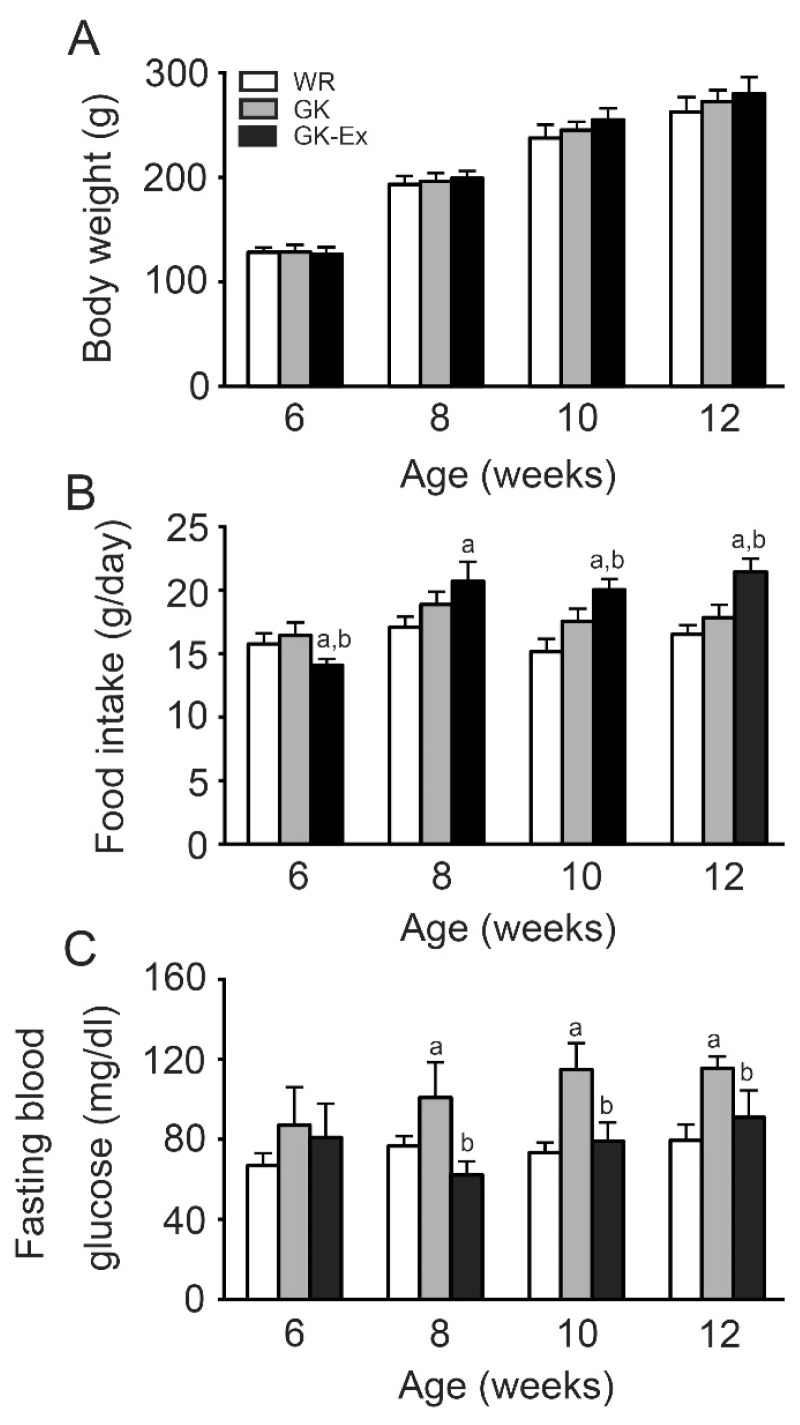
Fig. 2.
Body weight (A), food intake (B), and fasting blood glucose (C) in the Wistar (WR), Goto-Kakizaki (GK), and exercised Goto-Kakizaki (GK-Ex) groups. Blood glucose levels were measured after fasting for 15 h using blood samples collected from the tail vein of conscious rats. Values are expressed as mean ± SD (n=5 for WR and GK; n=10 for GK-Ex). a p<0.05 compared with WR; b p<0.05 compared with GK.

