FIG. 2.
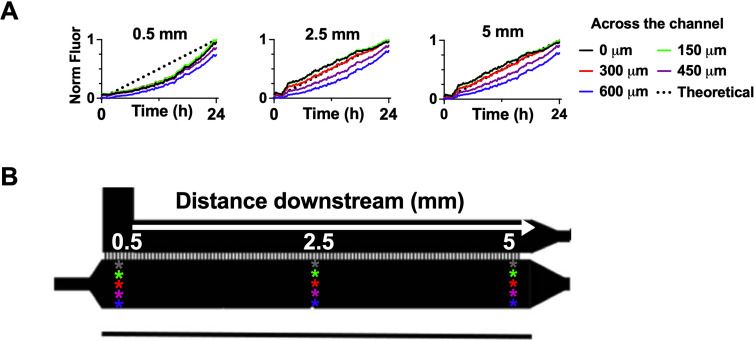
(a) Quantification of increasing concentration based on the fluorescent dextran signal at three distances along the cell chamber (0.5, 2.5, and 5 mm from beginning) and across the cell chamber (0, 150, 300, 450, and 600 μm from the diffusion ports at that location). (b) Schematic of analyzed locations, white arrow indicates direction of flow.

