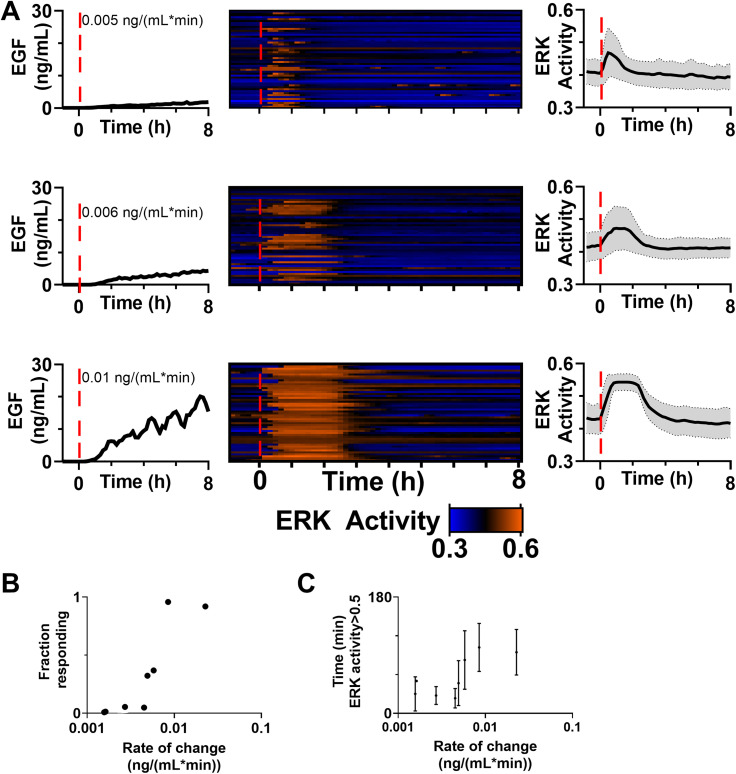
FIG. 5.
(a) ERK activity patterns in response to a varying the rate of change of EGF. Shown are dosing confirmed by fluorescently tagged dextran (left), heatmap of single-cell ERK activity for cells (middle), and average ERK activity (right). All time scales were adjusted so t = 0 when dextran (EGF) was first detected (also denoted by a red dotted line). (b) and (c) ERK activity patterns for cells over a range of rates of change, with ERK activity >0.5 classified as an active cell. Both the fraction of cells with active ERK (b) and the time in this active state (c) show a switch-like pattern with respect to the initial rate of change (b) kd = 0.0060, hill slope = 7.12, (c) kd = 0.0050, hill slope = 11.27, . Dots represent the fraction (b) or average time (c) of all the cells analyzed for a particular rate of change. In (c), bars indicate the SD. (b) and (c) also include the data from Fig. 3. n > 50 cells/condition.

