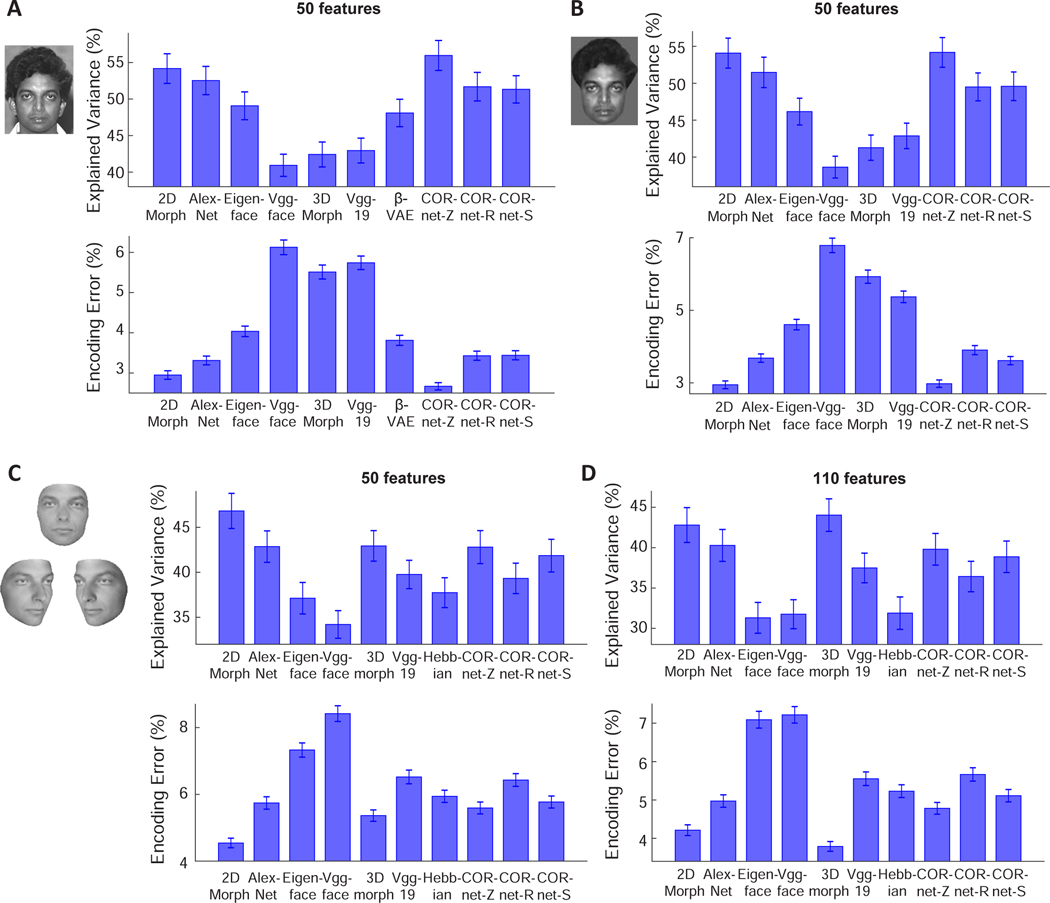
Figure 2. Comparing how well different models of face coding can explain AM neuronal responses to facial images.
A, For each model, 50 features were extracted using PCA and used to predict responses of AM neurons. Upper: Explained variances are plotted for each model. For each neuron, explained variance was normalized by the noise ceiling of that neuron (see STAR Methods). Error-bars represent s.e.m. for 148 cells. CORnet-Z performed significantly better than the other models (p<0.001 in all cases except from the 2D Morphable Model, p<0.01 between CORnet-Z and the 2D Morphable Model, Wilcoxon signed-rank test), and the 2D Morphable Model performed significantly better than the remaining models (p<0.01). Lower: Encoding errors are plotted for each model. Error-bars represent s.e.m. for 2100 target faces (i.e., error was computed for each target face when comparing to 2099 distractors, and s.e.m was computed for the 2100 errors). CORnet-Z performed significantly better than the other models (p<0.001 in all cases except from the 2D Morphable Model, p<0.01 between CORnet-Z and the 2D Morphable Model, Wilcoxon signed-rank test), and the 2D Morphable Model performed significantly better than the remaining models (p<0.001). B, To remove differences between models arising from differential encoding of image background, face images with uniform background were presented to different models (see STAR Methods). CORnet-Z and 2D Morphable Model performed significantly better than the other models (p<0.001), with no significant difference between the two models (p=0.30 for explained variance; p=0.79 for encoding error). C, To create facial images without hair, each facial image in the database was fit using a 3D Morphable Model (left). The fits were used as inputs to each model. For example, a new 2D Morphable Model was constructed by morphing the fitted images to an average shape. 50 features were extracted from each of the models using PCA for comparison. D, Same as C, but for 110 features. For 50 features, the 2D Morphable Model performed significantly better than the other models (p<0.001), while there was no significant difference between 3D Morphable Model and CORnetZ (p=0.19 for explained variance; p=0.21 for encoding error) or between 3D Morphable Model and AlexNet (p=0.56 for explained variance; p=0.06 for encoding error). For 110 features, the 3D Morphable Model outperformed all other models (p<0.01 between 2D Morphable Model and 3D Morphable Model for explained variance; p<0.001 in all other cases). Also see Figures S1, S2, and S3.

