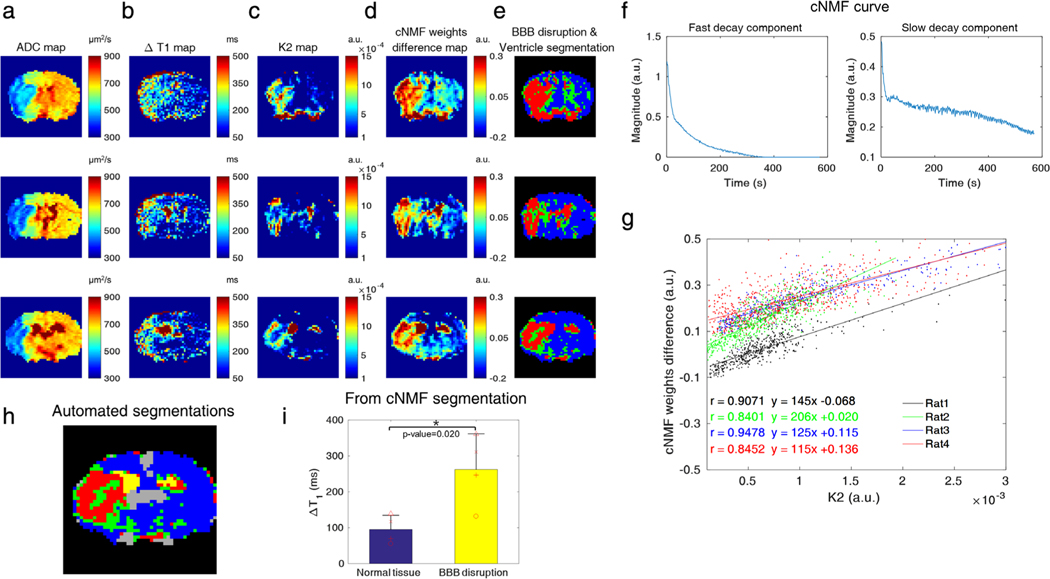
FIGURE 5:
a–d: The ADC map, ΔT1 map, K2 map, and cNMF-weights difference map with k (the number of patterns) = 2, respectively. e: The segmentation results to identify the BBB-damaged and ventricle regions (red: ventricle and BBB-damaged regions, green: a mixture of healthy and BBB-damaged brain, blue region: healthy brain). Each row of a–e corresponds to different adjacent slices of the same rat (rat2) and slices as displayed in Fig. 4a–d. f: Representative cNMF curves with k = 2 (left figure: fast decay component, right figure: slow decay component). g: Scatterplots between cNMF weight and K2 for four different rats (dot: data, line: correlation curve, black: rat1, green: rat2, blue: rat3, red: rat4). The ipsilateral regions that had larger K2 values (manual ROI-derived K2) than 10−4 were used for the scatterplots to relate K2 and cNMF weights. h: cNMF segmentations of five areas (yellow: ventricle, red: BBB-damaged regions, green: a mixture of healthy and BBB-damaged brain, blue: healthy brain, gray: large vessels). i: The values of ΔT1 from cNMF classified BBB-damaged regions (red) and corresponding normal tissue, indicating the association of BBB-damage with DSC-MRI-derived leakage index (K2). There was a significant ΔT1 difference between healthy brain tissue and BBB-damaged regions, as derived from the cNMF segmentation (n = 4, mean ± SD, P = 0.020, unpaired t-test).

