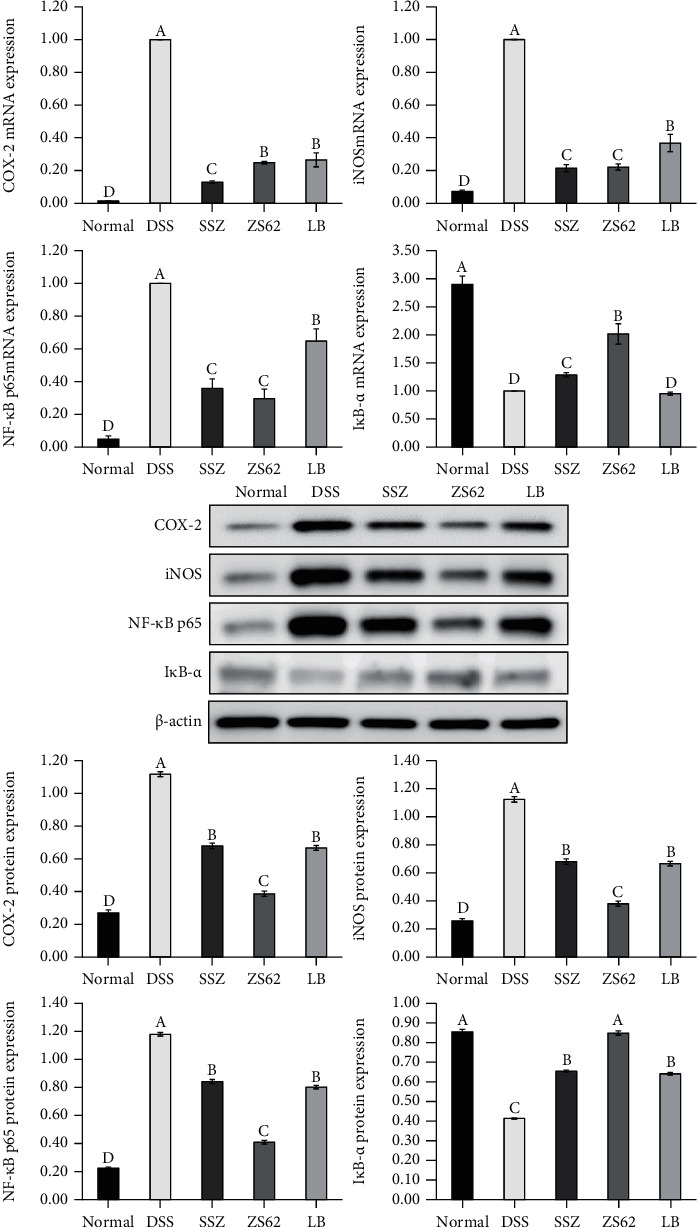
Figure 7.

The mRNA and protein expression levels of COX-2, iNOS, NF-κB p65, and IκB-α in mouse colon tissue. a–eMean values with different letters in the same column differ significantly (p < 0.05) by Duncan's multiple range test. Values presented are the means ± standard deviation (N = 10/group). Normal: mice fed a standard chow diet plus drinking water; DSS: mice fed the standard chow diet plus drinking water with 5% dextran sulfate sodium; SSZ: sulfasalazine (500 mg/kg of BW) plus 5% DSS; ZS62: Lactobacillus plantarum ZS62 (1.0 × 10⁹ CFU/mL) plus 5% DSS; LB: Lactobacillus bulgaricus (1.0 × 10⁹ CFU/mL) plus 5% DSS.
