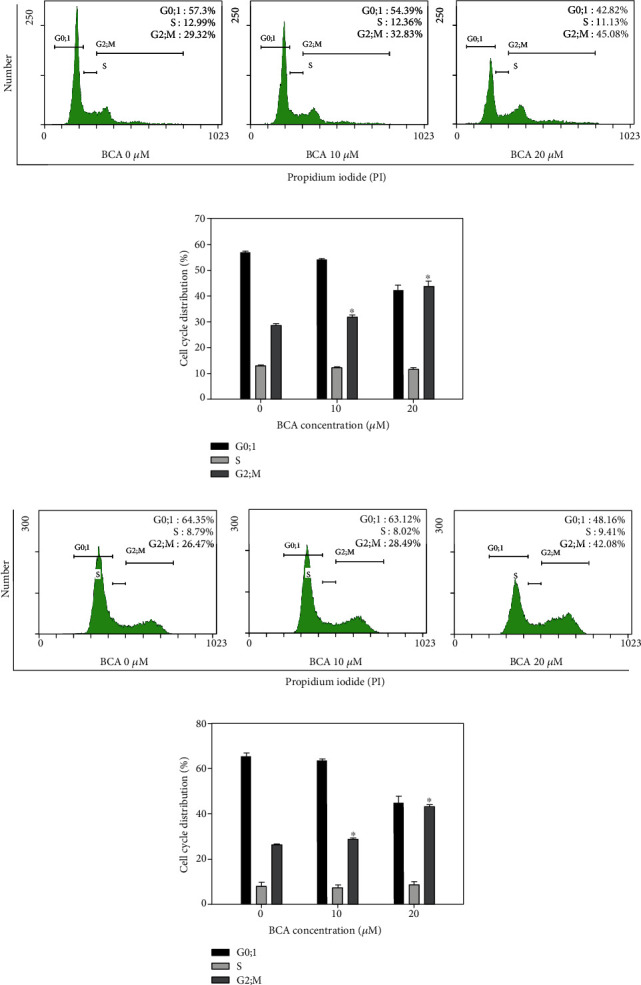
Figure 2.

G2/M cell cycle arrest in renal cancer A498 and ACHN cells. A498 and ACHN cells were treated with 0, 10, and 20 μM of BCA for 48 h and stained with propidium iodide. Following that, the cells were measured with FACS. The cytogram results showed that the cell distribution and percentage of cells in each proportion of the cell cycle were represented for (a) A498 and (c) ACHN cells. Distribution of (b) A498 and (d) ACHN cells of each proportion of the cell cycle was shown after BCA treatment. Significant differences between BCA treat and DMSO control groups are indicated as ∗ (∗ means p < 0.05).
