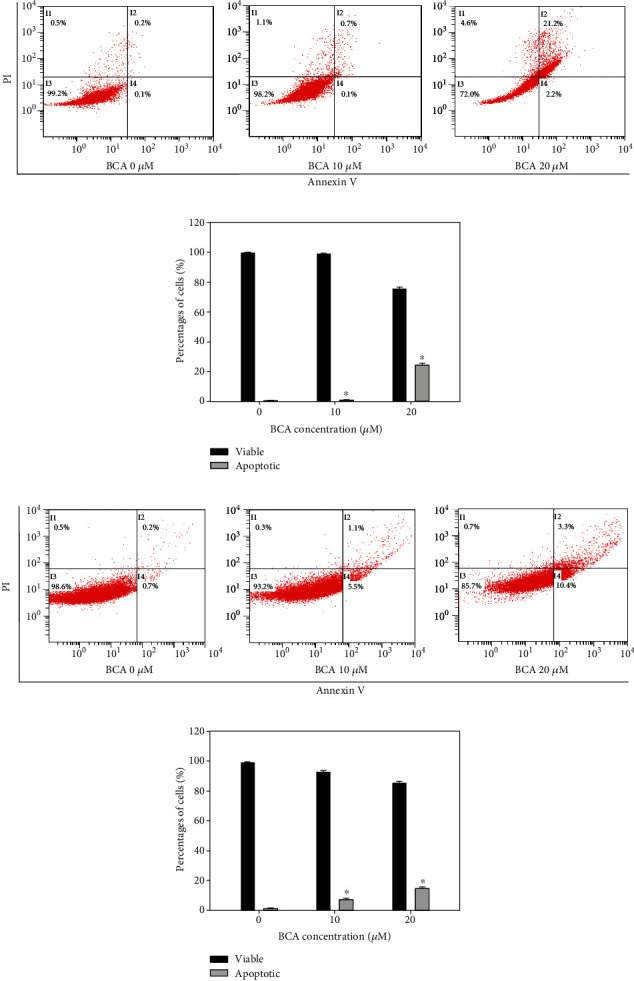
Figure 3.

Induction of apoptotic cell death in A498 and ACHN cells by the annexin V and PI doubling staining assay following 48 h of treatment with BCA (0, 10, and 20 μM). (a, c) The percentages of apoptotic cells against A498 and ACHN cells are represented in cytogram. (b, d) Percentages of viable and apoptotic cells were indicated in bar graphs. The error bar represented the standard error. Significant differences between BCA treat and DMSO control groups are indicated as ∗ (∗ means p < 0.05).
