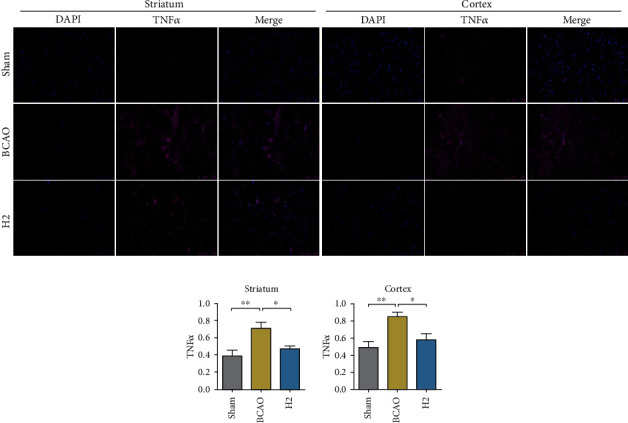
Figure 5.

Immunofluorescence data of TNFα- and DAPI-stained mouse brain slices and bar graphs displaying measurements. (a) Mouse brain slices were stained with TNFα (magenta) and DAPI (blue), and regions of the striatum and cerebral cortex were visualized under a microscope (20× magnification). (b) Bar graphs displaying immunofluorescence measurements. The intensity of TNFα was calibrated in proportion to DAPI in each sample (n = 8, 7, and 9 for sham, BCAO, and H2 groups, respectively). BCAO: bilateral common carotid artery occlusion; ∗∗p < 0.01, ∗p < 0.05.
