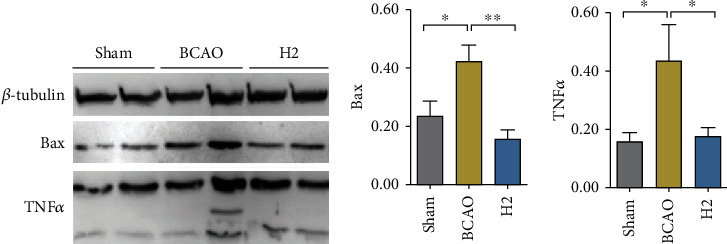
Figure 6.

Immunoblot analysis of Bax and TNFα in the mouse brain hippocampus and bar graphs displaying measurements. (a) β-Tubulin, Bax, and TNFα in the mouse hippocampus were transferred to a membrane and visualized. Two bands per group are presented. (b) Bar graphs displaying immunoblot measurements of Bax quantification and TNFα. Both were normalized by β-tubulin measurements (n = 8 for each group); ∗∗p < 0.01, ∗p < 0.05.
