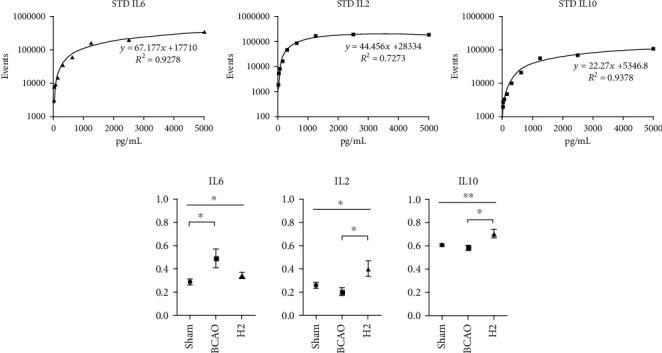
Figure 7.

Standard curves fit to calibration data from serially diluted standard references and comparisons of IL-6, IL-2, and IL-10 between groups for whole mouse brain. (a) Standard curves of diluted IL-6, IL-2, and IL-10. (b) Comparisons of cytokine concentrations between groups (n = 12, 10, and 12 for sham, BCAO, and H2 groups, respectively). BCAO: bilateral common carotid artery occlusion; ∗∗p < 0.01, ∗p < 0.05.
