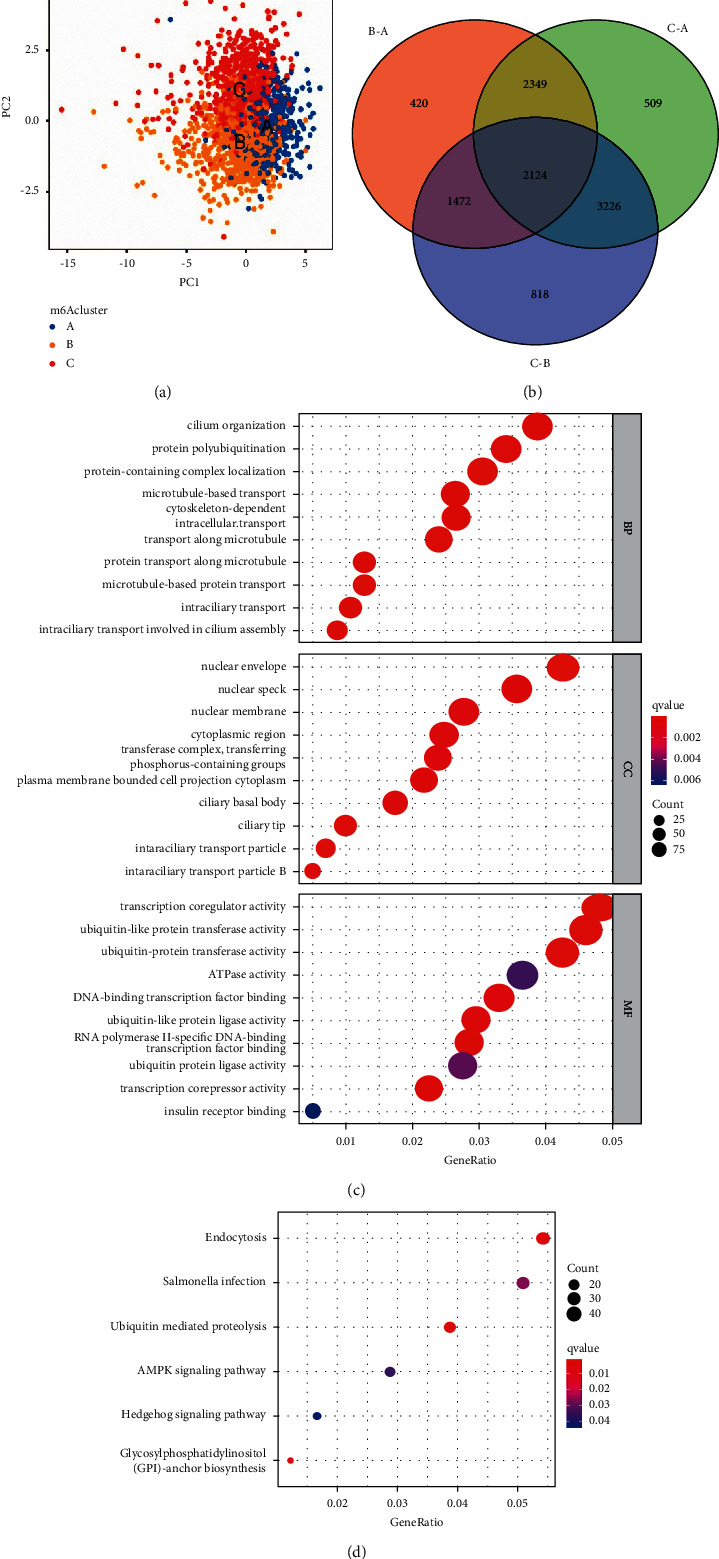
Figure 4.

Transcriptome characteristics between different m6A modification patterns in breast cancer. (a) Principal component analysis revealed significant differences in the transcriptome between different m6A modification patterns. (b) Venn diagram showing the differentially expressed genes among the three m6A clusters. GO enrichment analysis was used to annotate m6A-related genes: (c) GO pathway and (d) KEGG pathway.
