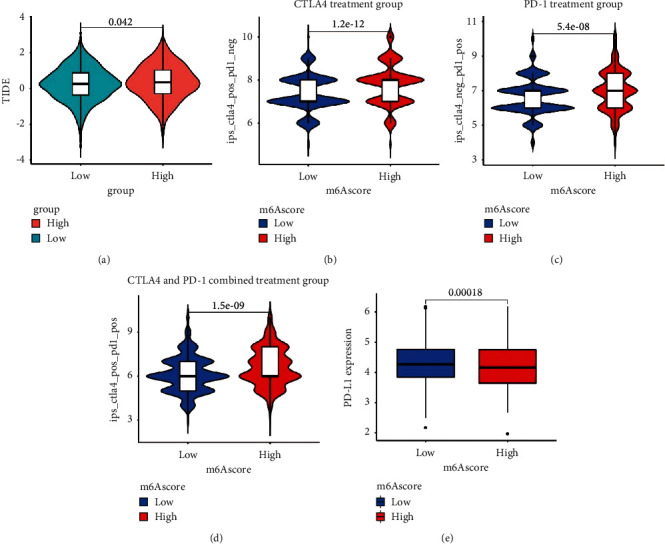
Figure 7.

m6Ascore prediction of immunotherapy effects. (a) Relative distribution of TIDE was compared between the high- and low-m6Ascore groups. Treatment effects of CTLA-4 or PD-1 and combined CTLA-4 and PD-1 were evaluated in patients with high and low m6Ascores: (b) CTLA-4 treatment group, (c) PD-1 treatment group, and (d) CTLA-4 and PD-1 combined treatment group. (e) Difference in PD-L1 expression between the high- and low-m6Ascore groups (P=0.00018).
