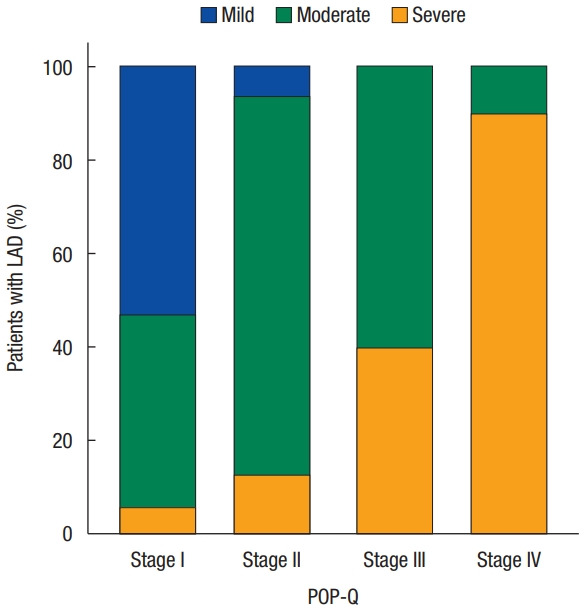
Fig. 2.

Bar chart for the stages of prolapse and levator ani deficiency (LAD) frequency. The Y-axis denotes the percentile of patients with mild, moderate, or severe LAD. The X-axis denotes the stage of prolapse, as determined by the Pelvic Organ Prolapse Quantification staging system (POP-Q).
