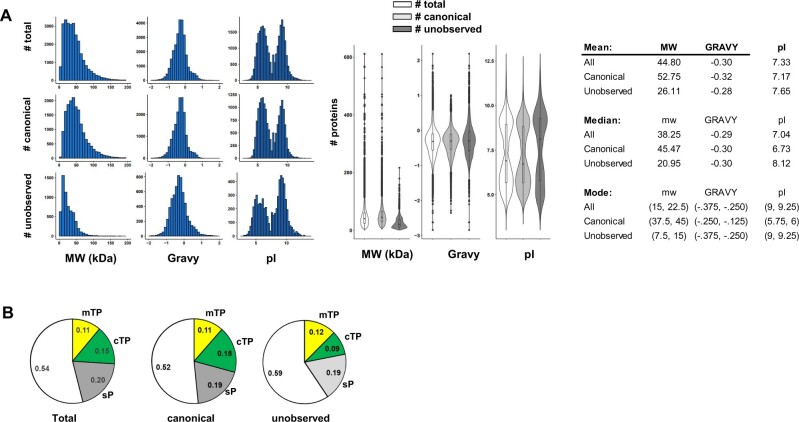
Figure 11.
Distribution of the physicochemical properties and subcellular locations of the predicted (27,655 proteins), canonical (17,857 proteins), and unobserved (6,255 proteins) in the Araport11 proteome. A, Frequency distributions for size, GRAVY, and pI for the three proteomes shown as histograms and violin plots. The table shows mean, median, and mode (min–max bin value) of molecular weight and GRAVY for the three proteomes. B, Distribution of subcellular localizations of nucleus-encoded proteins in the three proteomes based on predicted sP (secreted–gray), cTP (plastid–green), and mTP (mitochondria–yellow).

