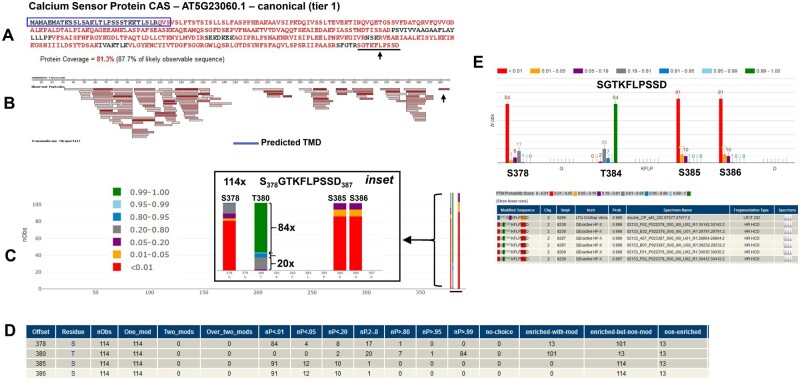
Figure 13.
Illustration of the functionality of PeptideAtlas for the determination of phospho-sites based on the example of the thylakoid CAS AT5G23060.1. A, Coverage by MS/MS for the primary sequence (81.3%) with identified residues in red. The predicted cleavable chloroplast sP is indicated in blue, but the spectral evidence suggests that the real sP is shorter. B, Matched peptides projected on the primary sequence. Darker red rectangles indicate higher numbers of PSMs for each peptide. The predicted thylakoid transmembrane domain is indicated as a blue rectangle (we show the N- and C-termini as facing the chloroplast stromal site based on Cutolo et al. (2019)). C, Probabilities of localization of phosphates on potential sites (as indicated by the colored bars) along the complete protein sequence. The inset provides a close-up view of the C-terminal peptide SGTKLPSSD and the frequency of specific p-sites, color-coded by localization probability. This shows e.g. that the phosphorylated peptide was observed 114 times and that pT380 was observed 84 times at the highest significance level. D, This small table provides a numerical summary of the p-site observations and information about specific sample enrichment for phospho-peptides based on metadata information collected from the individual PXD submissions. This shows that the peptide SGTKFLPSSD was observed 13 times in samples that were not enriched for p-peptides and 114 times as a single p-peptide from enriched samples. Explanation for columns: Offset – residue number from start; Residue – amino acid; nObs–Total observed PTM spectra for the site; One_mod–the number of PSMs with a single phosphate covering the site. Two_mods–the number of PSMs that have two observed phosphates (i.e. doubly phosphorylated). Over_two_mods–the number of PSMs covering the site that have more than two phosphates. nP < 0.01 − PTMProphet probability < 0.01; nP < 0.05 − PTMProphet probability ≥ 0.01 and < 0.05; nP < 0.20 − PTMProphet probability ≥ 0.05 and ≤ 0.20; nP 0.2–0.8 − PTMProphet probability > 0.20 and < 0.80; nP > 0.80 − PTMProphet probability ≥ 0.80 and < 0.95; nP>0.95 − PTMProphet probability ≥ 0.95 and < 0.99; nP>0.99 − PTMProphet probability ≥ 0.99; no-choice − Number of PSMs covering this site for which there was no choice in the localization of the PTM. Only one residue was an S, T, or Y; enriched-with-mod − Number of PSMs covering this site with phospho modification on this site, and originating from a phospho-enriched sample; enriched-but-non-mod − Number of PSMs covering this site with no phospho modification anywhere on the peptide, but yet originating from a phospho-enriched sample; nonenriched − Number of PSMs covering this site from a nonenriched sample (phospho not considered in the search). E, Detailed view of the phosphorylated peptide SGTKLPSSD and p-site localization probability distributions. The lower panel shows information at an individual spectral level with hyperlinked access to the annotated spectra.

