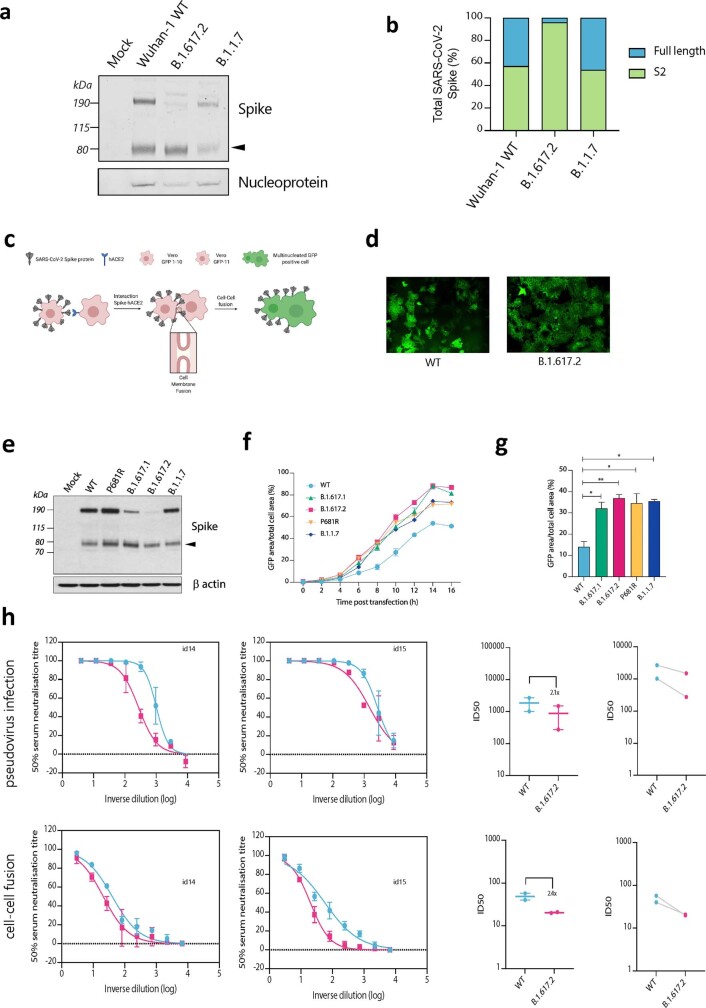
Extended Data Fig. 2. Spike cleavage in B.1.617.2 virions compared to B.1.1.7. and spike mediated cell-cell fusion.
a. Representative western blot analysis of spike and nucleoprotein present in SARS-CoV-2 particles from the indicated viruses produced in Vero E6 ACE2/TMPRSS2 cells 48 h post infection. The arrowhead identifies the S2 subunit. b. Quantification of cleaved and full-length spike of the indicated viruses. c. Schematic of cell-cell fusion assay. d. Reconstructed images at 10 h of GFP positive syncytia formation. Scale bars represent 400 mm. e. western blot of cell lysates 48 h after transfection of spike plasmids.f,g. Quantification of cell-cell fusion kinetics showing percentage of green area to total cell area over time. Mean is plotted with error bars representing SEM. h. Comparison of impact of post vaccine sera (n = 2) on PV neutralisation (top) and cell-cell fusion (bottom), comparing WT and Delta variant B.1.671.2. Data are representative of at least two independent experiments.

