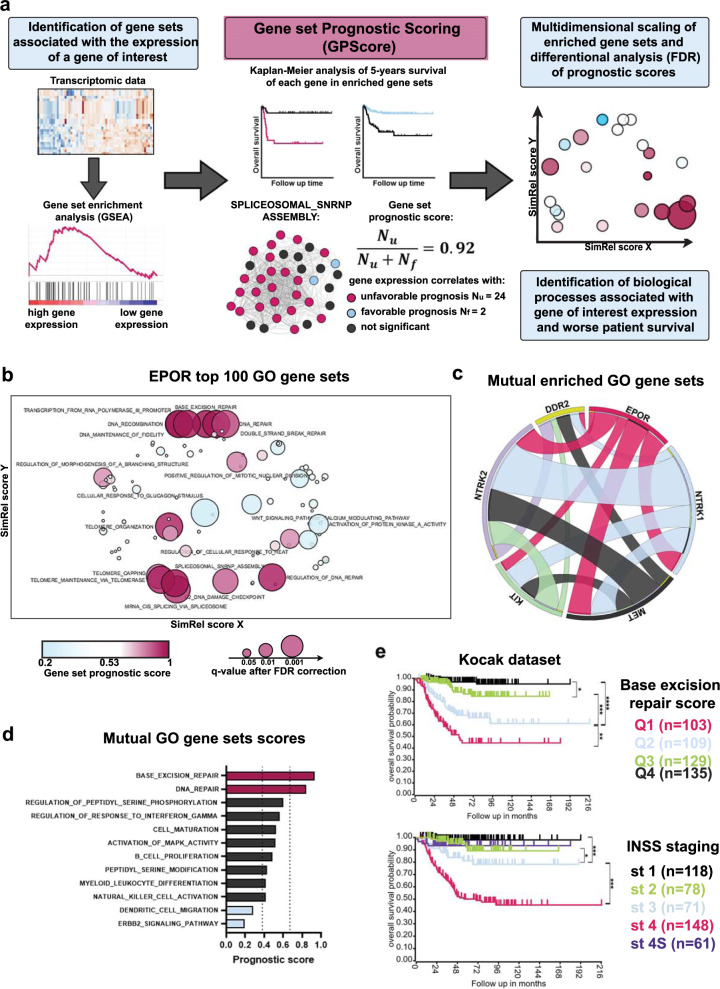
Fig. 3. Gene set prognostic scoring for growth factor receptors in NB tumors.
a Design of a GPScore (Gene set prognostic scoring) algorithm for calculation of gene prognostic scores, data visualization, and analysis. SPLICEOSOMAL_SNRNP_ASSEMBLY gene set is provided as an example. b Multidimensional scaling of enriched gene sets associated with EPOR expression in NB patients. Only gene sets with prognostic scores that passed the FDR test (q value < 0.01) are marked. c Circos plot showing the number of shared gene sets calculated by GSEA for each gene pair. The width of ribbons is proportional to the number of shared enriched gene sets. d Prognostic scores for 12 enriched gene sets shared by at least 5 of 6 genes. Dot lines indicate 3 sigma interval for prognostic scores distribution for 20 randomly generated gene sets. e Kaplan–Meier survival analysis for Kocak dataset (n = 476) based on base-excision repair score (divided into quartiles from highest Q1 to lowest Q4 scores) and INSS stages. A similar analysis for NRC and Versteeg datasets is provided in Fig. S5b.

