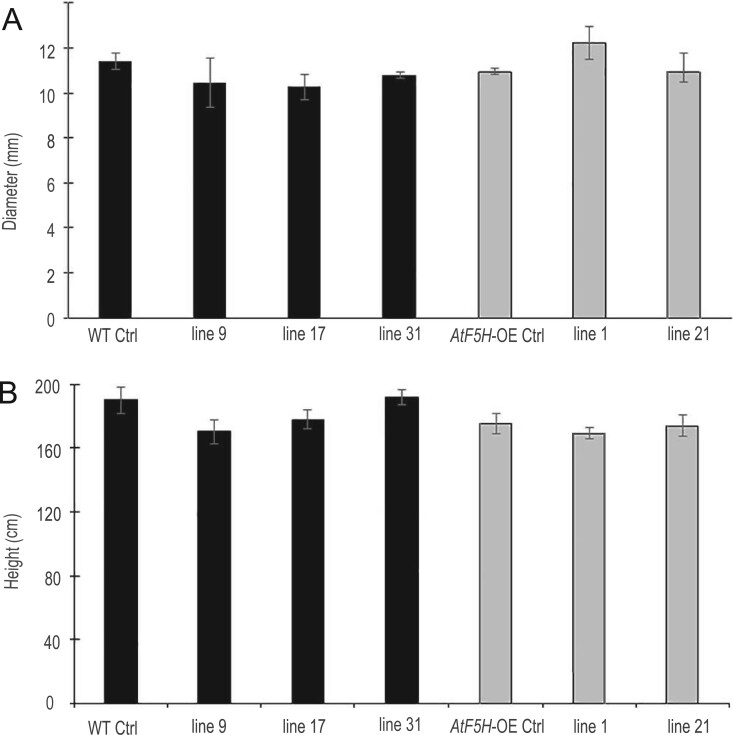
Figure 1.
Growth response to the introduction of the proAtC4H::BdPMT1 construct into the poplar WT background (black bars) and into the AtF5H-OE background (gray bars), as compared to control (Ctrl) trees. The basal diameter (A) and the tree height (B) were measured on 3-month-old greenhouse-grown trees. Data are means (sd) values of three or four biological replicates. Duncan tests (at P < 0.05) did not reveal any significant differences between poplar lines.

