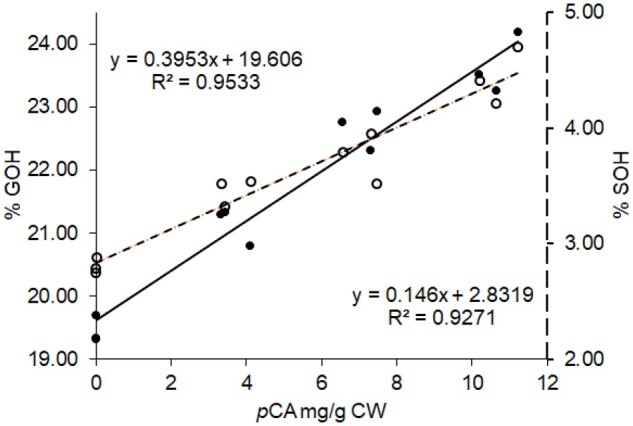
Figure 4.

Relationships between the pCA amounts in poplar CWs and the percentage of G lignin units with free phenolic groups (%GOH, black circles, full line) or the percentage of S lignin units with free phenolic groups (%SOH, white circles, dotted lines). The lignin structural traits %GOH and %SOH are evaluated by thioacidolysis of permethylated samples for BdPMT1-OE poplars and their WT controls
