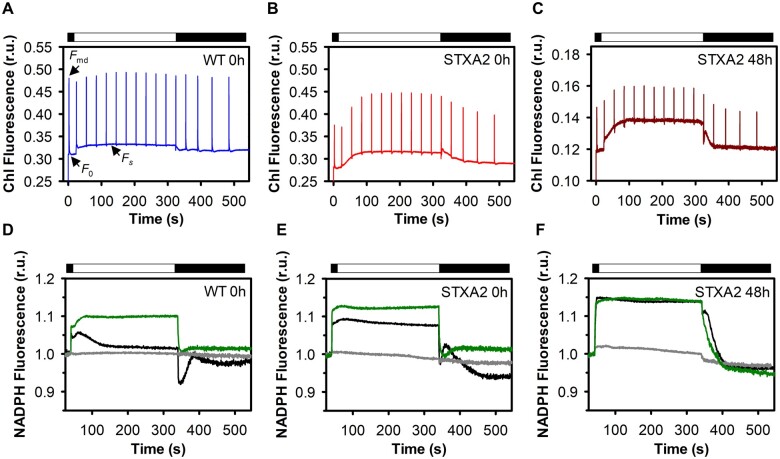
Figure 5.
Responses of Chl and NADPH kinetics to changes in TrxA levels. Fluorescence induction curves in (A) WT and (B) STXA2 in the presence of inducer, and (C) STXA2 after 48 h of inducer removal. Cells were dark adapted for 15 min and then exposed to actinic light of 50-µmol photons m−2·s−1 for 5 min. Saturating pulses of 10,000 µmol photons m−2·s −1 (200 ms) were applied every 30 s. The cultures were adjusted to 4 ×10⁷ cells before the measurements. NADPH fluorescence in (D) the WT and (E) STXA2 in the presence of inducer, and (F) STXA2 after 48 h of inducer removal. Cells were dark adapted for 15 min in the absence of inhibitor (black traces) and in the presence of 20-μM DCMU (gray traces) or 10-mM GA (green traces), then exposed to red actinic light of 50-µmol photons m−2·s −1 for 5 min. Data are means ± sd from three biological replicates in all cases. r.u., relative units.

