Figure 6.
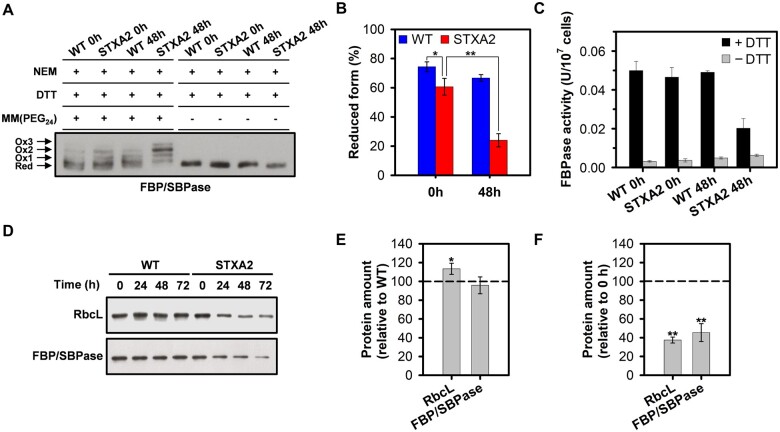
Changes in CBB protein levels and in vivo redox state of FBP/SBPase in response to different TrxA levels. A, In vivo redox state of FBP/SBPase in WT and STXA2 strains. Proteins were extracted from cells before (0 h) and after 48 h of inducer removal (48 h) and labeled with the alkylating agent MM(PEG24) as described in the “Materials and methods”. Red, reduced form; Ox, oxidized form. B, Reduction level of FBP/SBPase is defined as the ratio of the reduced form and the sum of reduced and oxidized forms. C, In situ FBPase activity from WT and STXA2 cells growing under standard conditions before (0 h) and after 48 h of inducer removal (48 h). DTT 10 mM was added to reduce the enzyme and determine the maximal activity. D, Western blot analysis of the RbcL and FBP/SBPase before (0 h) and after inducer removal (24–72 h). Samples equivalents to 4 ×10⁷ cells were taken at the indicated times and total proteins were isolated and resolved on SDS–PAGE, blotted and incubated with specific antibodies referenced in Supplemental Table S2. E, Quantification of the indicated proteins in the STXA2 strain before inducer removal (0 h) relative to the WT (dashed line). *P < 0.05 (two-tailed Student’s t test between WT and STXA2 strains). F, Quantification of the indicated proteins in the STXA2 strain after 48 h inducer removal relative to the signal with inducer (0 h; dashed line). Data are means ± sd from three biological replicates in all cases. **P < 0.01 (two-tailed Student’s t test between 0 and 48 h).

