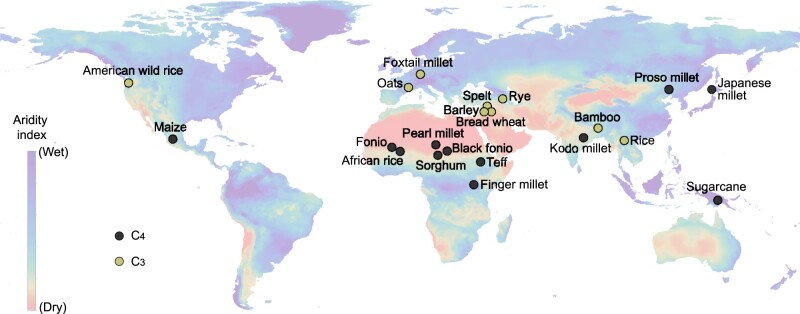
Figure 3.
Domestication and origin of major C3 and C4 crops and cereals. The putative centers of origin for major domesticated grasses are shown with C4 species highlighted in black and C3 species highlighted in yellow. The aridity index is overlaid; blue regions are the least arid and orange regions the most arid. Data for the crop origins were adapted from (Milla, 2020).

