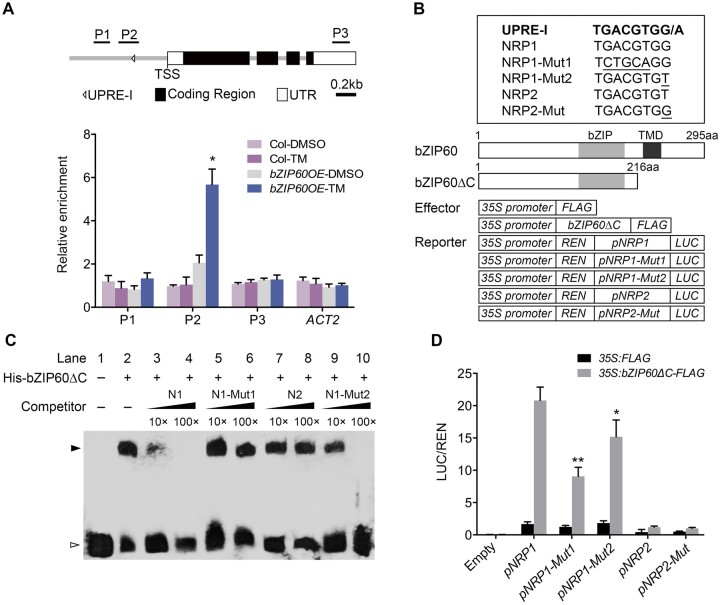
Figure 4.
bZIP60 activates the expression of NRP1 by directly binding to its promoter. A, ChIP analysis of bZIP60 binding to the NRP1 promoter. The upper part shows schematic diagram of the NRP1 genomic regions. P1–P3 indicate fragments for ChIP-qPCR amplification. The lower part shows ChIP analysis of bZIP60 binding to the NRP1 genomic regions upon the precipitation with anti-FLAG antibody. Seven-day-old seedlings of 35S:FLAG-bZIP60 and Col were treated with 1 μg/mL TM (DMSO as mock) for 4 h and harvested for ChIP assay. The enrichment of Actin 2 (ACT2) genomic fragment was used as the negative control. PP2A was used as an internal control for ChIP analysis. The values are means ± sd of biological triplicates. Asterisks indicate significant differences compared with mock (Student’s t test, *P < 0.01). B, The upper panel shows the UPRE-I element sequence and its mutated sequences used for EMSA (C) and transient expression assay (D). The lower panel shows the schematic diagrams of the effector and reporter constructs used in transient expression assay in (D). aa, amino acid. C, EMSA experiment detecting the protein–DNA binding. The purified His-bZIP60ΔC was incubated with the biotin-labeled NRP1 DNA fragments (40 bp) (Lane 2–10). The un-labeled NRP1/2 DNA and various mutated NRP1 DNA were use as cold competitors. Lane 3, 10× un-labeled NRP1 (N1); lane 4, 100× unlabeled NRP1; lane 5, 10× unlabeled mutated form NRP1-Mut1 (N1-Mut1); lane 6, 100× unlabeled mutated form NRP1-Mut1; lane 7, 10× unlabeled form NRP2 (N2); lane 8, 100× unlabeled form NRP2; lane 9, 10× unlabeled mutated form NRP1-Mut2 (N1-Mut2); lane 10, 100× unlabeled mutated form NRP1-Mut2. Black and white arrow heads point to the positions of shifted bands and free probes, respectively. D, Transient expression assay of the expression of NRP1 regulated by bZIP60. pNRP1:LUC (pNRP1), pNRP1-Mut1:LUC (pNRP1-Mut1), pNRP1-Mut2:LUC (pNRP1-Mut2), pNRP2:LUC (pNRP2), pNRP2-Mut:LUC (pNRP2-Mut), and empty vector (Empty) were co-transformed with 35S:bZIP60ΔC-FLAG effectors (35S:FLAG as a control) into Arabidopsis Col mesophyll protoplasts and cultured overnight. The LUC activity was calculated by relative LUC activity (LUC/REN). The values are means ± sd of biological triplicates. Asterisks indicate significant differences between pNRP1:LUC and pNRP1-Mut1:LUC or pNRP1-Mut2:LUC (Student’s t test, *P < 0.05; **P < 0.01).

