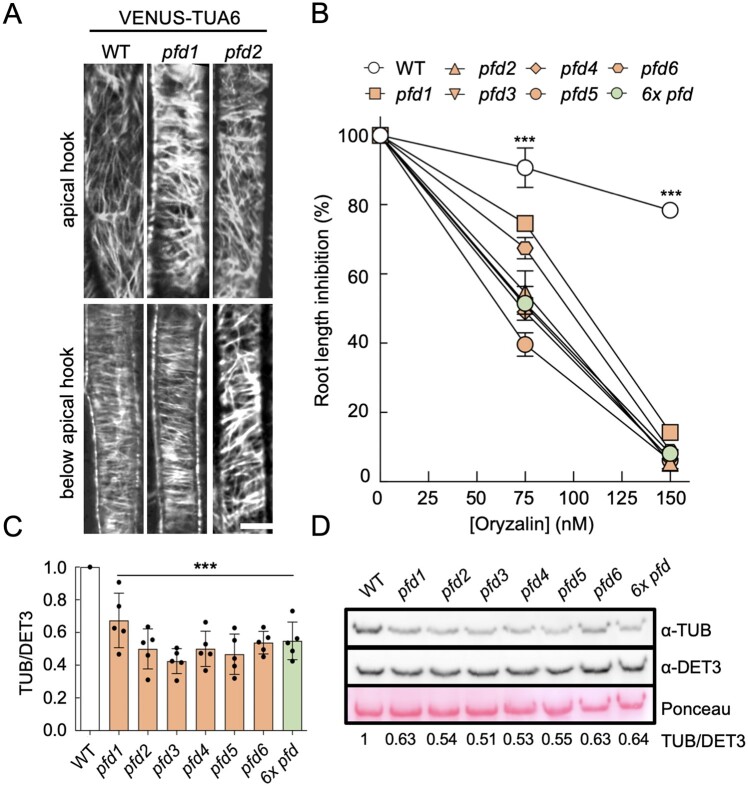
Figure 2.
MT alterations in pfd mutants. A, Representative confocal images of VENUS-TUA6 in wild-type (WT), pfd1, and pfd2 hypocotyl cells (four hypocotyls were imaged per genotype). Scale bar = 10 μm. B, Effect of oryzalin on root elongation. The graph shows the average of two biological replicates (n = 8–16 roots per genotype, treatment and biological replicate). Error bars indicate standard error of mean. ***P < 0.001 in a two-way ANOVA test. C, Levels of α-tubulin relative to DET3. Data are the average of five independent experiments. ***P < 0.001 compared to the WT in Dunnet’s multiple comparison test after ANOVA test. D, Representative western blot showing α-tubulin levels in the WT and in pfd mutants. DET3 was used as loading control. The ratio of tubulin/DET3 of this representative blot is shown.

