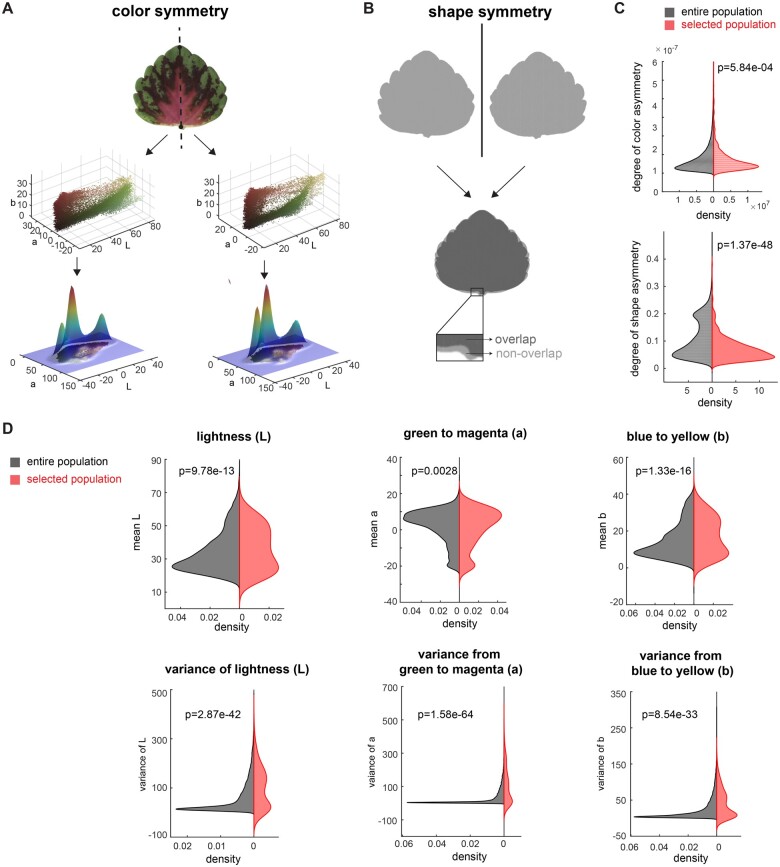
Figure 4.
Influence of color and shape on cultivar selection. A, Mirror symmetry of color: Partitioning of each leaf into left and right halves (top panel), convert each part into 3D point cloud in Lab color space (middle panel), and calculate the 3D Gaussian density estimator (lower panel, only shows 2D Gaussian density estimator for visualization). B, Mirror symmetry of shape: flip the leaf horizontally (top panel), measure the non-overlapped area (lower panel) and calculate the percentage of a non-overlapped area over the leaf area. C, Distribution of degree of color asymmetry (top panel) and shape asymmetry (bottom panel) for the entire population (in black) and selected population (in red), D, Distribution of mean L (top left), mean a (top middle), mean b (top right), variance of L (bottom left), variance of a (bottom middle), and variance of b (bottom right) for entire population (in black) and selected population (in red). Significance was measured using a two-sample Kolmogorov-Smirnov test for the distribution difference for uneven sample sizes.

