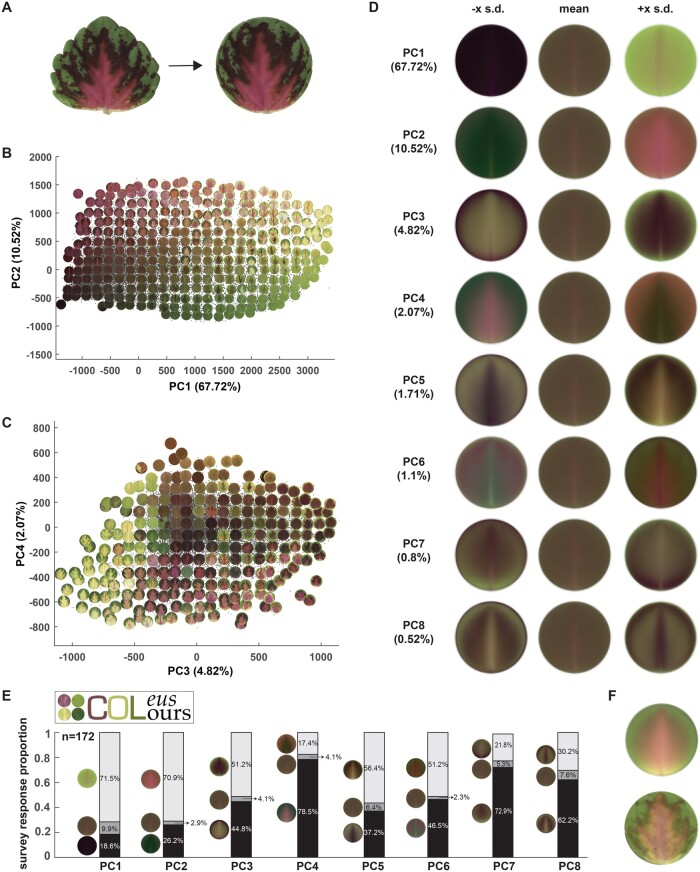
Figure 5.
Public survey for color preferences using shape-transformed leaves. A, Deform each leaflet into a disk by thin-plate spline interpolation—non-linear deformation into a unit circle. B and C, PCA plot superimposed upon some example of leaves [PC1 vs PC2 in (B) and PC3 vs PC4 in (C)] for the pixel Lab values of a deformed leaflet. D, Eigencolors for the first eight PCs and the percentage of variance they explained. For PC k, the eigencolor at −x SD and +x SD along PC axis is shown, where x = 3+(k-1)×0.5 for better visualization. E, Survey logo (top left) and the survey result from 172 responses. White bars = the proportion of responses in favor of positive eigencolors, grey bars = the proportion of responses that selected mean eigencolors, and black bars = the proportion of responses that selected negative eigencolors. F, Reconstructed pattern (top) and closest real leaf (bottom) from first eight eigencolors with weights guided by the survey response proportion. Raw survey data is available in Supplemental Dataset S2.

