Figure 5.
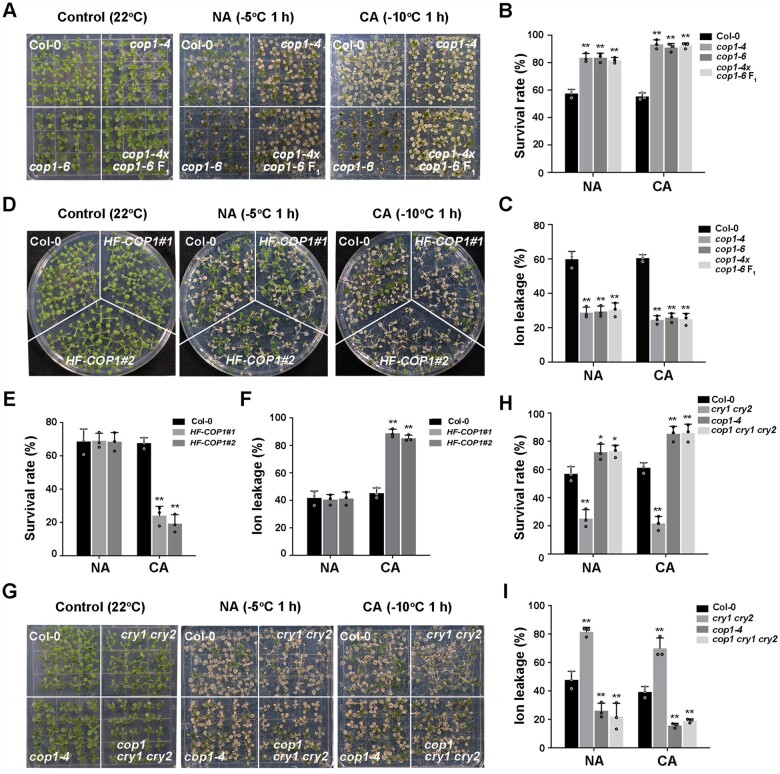
COP1 acts genetically downstream of CRYs to negatively regulate plant freezing tolerance. A–C, Freezing phenotypes (A), survival rates (B), and ion leakage (C) of Col-0, cop1-4, cop1-6, and cop1-4 × cop1-6 F1 seedlings. D–F, Freezing phenotypes (D), survival rates (E), and ion leakage (F) of Col-0 and COP1 overexpression transgenic lines (HF-COP1#1, HF-COP1#2). G–I, Freezing phenotypes (G), survival rates (H), and ion leakage (I) of Col-0, cry1 cry2, cop1-4, and cop1 cry1 cry2 seedlings. In (B–I), data are means of three independent experiments ± SEM; each experiment was repeated three times (n = 30). Asterisks indicate significant differences compared with Col-0 under the same treatment (*P < 0.05, **P < 0.01, Student’s t test).

